
Page 195 - Biomedical Engineering and Design Handbook Volume 1, Fundamentals
P. 195
172 BIOMECHANICS OF THE HUMAN BODY
EMG data
1
0.8
0.6
0.4
Normalized amplitude –0.2 0
0.2
–0.4
–0.6
–0.8
–1
0 0.2 0.4 0.6 0.8 1 1.2 1.4 1.6 1.8 2
Time (seconds)
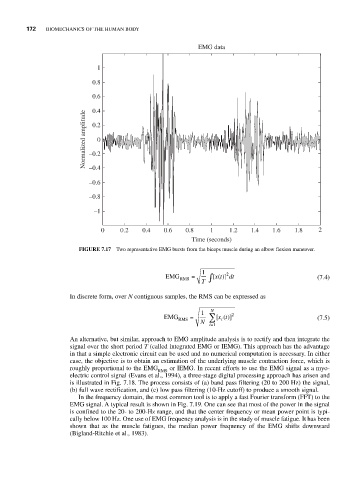
FIGURE 7.17 Two representative EMG bursts from the biceps muscle during an elbow flexion maneuver.
1 2
EMG = ∫ [( )] dt (7.4)
xt
RMS
T
In discrete form, over N contiguous samples, the RMS can be expressed as
1 N 2
EMG = ∑ [( )] (7.5)
xt
RMS i
N
= i 1
An alternative, but similar, approach to EMG amplitude analysis is to rectify and then integrate the
signal over the short period T (called integrated EMG or IEMG). This approach has the advantage
in that a simple electronic circuit can be used and no numerical computation is necessary. In either
case, the objective is to obtain an estimation of the underlying muscle contraction force, which is
roughly proportional to the EMG or IEMG. In recent efforts to use the EMG signal as a myo-
RMS
electric control signal (Evans et al., 1994), a three-stage digital processing approach has arisen and
is illustrated in Fig. 7.18. The process consists of (a) band pass filtering (20 to 200 Hz) the signal,
(b) full wave rectification, and (c) low pass filtering (10-Hz cutoff) to produce a smooth signal.
In the frequency domain, the most common tool is to apply a fast Fourier transform (FFT) to the
EMG signal. A typical result is shown in Fig. 7.19. One can see that most of the power in the signal
is confined to the 20- to 200-Hz range, and that the center frequency or mean power point is typi-
cally below 100 Hz. One use of EMG frequency analysis is in the study of muscle fatigue. It has been
shown that as the muscle fatigues, the median power frequency of the EMG shifts downward
(Bigland-Ritchie et al., 1983).