
Page 194 - Biomedical Engineering and Design Handbook Volume 1, Fundamentals
P. 194
BIOMECHANICS OF THE MUSCULOSKELETAL SYSTEM 171
200 μV
A
15 ms
B
20 μV
100 ms
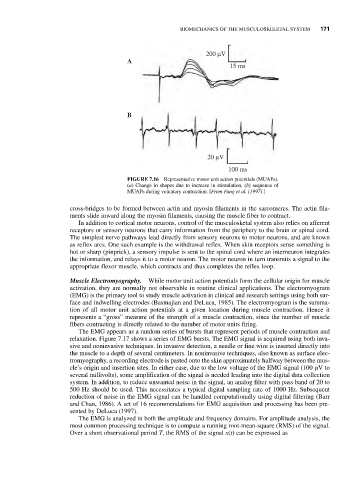
FIGURE 7.16 Representative motor unit action potentials (MUAPs).
(a) Change in shapes due to increase in stimulation, (b) sequence of
MUAPs during voluntary contraction. [From Fang et al. (1997).]
cross-bridges to be formed between actin and myosin filaments in the sarcomeres. The actin fila-
ments slide inward along the myosin filaments, causing the muscle fiber to contract.
In addition to cortical motor neurons, control of the musculosketal system also relies on afferent
receptors or sensory neurons that carry information from the periphery to the brain or spinal cord.
The simplest nerve pathways lead directly from sensory neurons to motor neurons, and are known
as reflex arcs. One such example is the withdrawal reflex. When skin receptors sense something is
hot or sharp (pinprick), a sensory impulse is sent to the spinal cord where an interneuron integrates
the information, and relays it to a motor neuron. The motor neuron in turn transmits a signal to the
appropriate flexor muscle, which contracts and thus completes the reflex loop.
Muscle Electromyography. While motor unit action potentials form the cellular origin for muscle
activation, they are normally not observable in routine clinical applications. The electromyogram
(EMG) is the primary tool to study muscle activation in clinical and research settings using both sur-
face and indwelling electrodes (Basmajian and DeLuca, 1985). The electromyogram is the summa-
tion of all motor unit action potentials at a given location during muscle contraction. Hence it
represents a “gross” measure of the strength of a muscle contraction, since the number of muscle
fibers contracting is directly related to the number of motor units firing.
The EMG appears as a random series of bursts that represent periods of muscle contraction and
relaxation. Figure 7.17 shows a series of EMG bursts. The EMG signal is acquired using both inva-
sive and noninvasive techniques. In invasive detection, a needle or fine wire is inserted directly into
the muscle to a depth of several centimeters. In noninvasive techniques, also known as surface elec-
tromyography, a recording electrode is pasted onto the skin approximately halfway between the mus-
cle’s origin and insertion sites. In either case, due to the low voltage of the EMG signal (100 μV to
several millivolts), some amplification of the signal is needed leading into the digital data collection
system. In addition, to reduce unwanted noise in the signal, an analog filter with pass band of 20 to
500 Hz should be used. This necessitates a typical digital sampling rate of 1000 Hz. Subsequent
reduction of noise in the EMG signal can be handled computationally using digital filtering (Barr
and Chan, 1986). A set of 16 recommendations for EMG acquisition and processing has been pre-
sented by DeLuca (1997).
The EMG is analyzed in both the amplitude and frequency domains. For amplitude analysis, the
most common processing technique is to compute a running root-mean-square (RMS) of the signal.
Over a short observational period T, the RMS of the signal x(t) can be expressed as