
Page 352 - Biomedical Engineering and Design Handbook Volume 2, Applications
P. 352
330 DIAGNOSTIC EQUIPMENT DESIGN
A B
a d
b e
c f
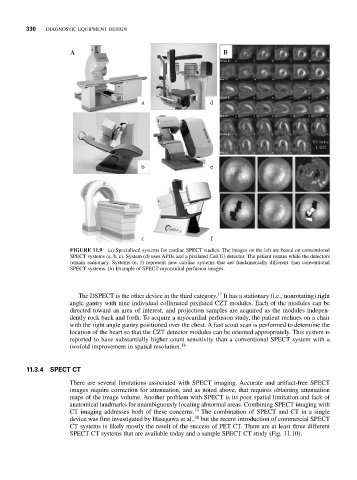
FIGURE 11.9 (a) Specialized systems for cardiac SPECT studies. The images on the left are based on conventional
SPECT systems (a, b, c). System (d) uses APDs and a pixilated CsI(Tl) detector. The patient rotates while the detectors
remain stationary. Systems (e, f) represent new cardiac systems that are fundamentally different than conventional
SPECT systems. (b) Example of SPECT myocardial perfusion images.
17
The DSPECT is the other device in the third category. It has a stationary (i.e., nonrotating) right
angle gantry with nine individual collimated pixilated CZT modules. Each of the modules can be
directed toward an area of interest, and projection samples are acquired as the modules indepen-
dently rock back and forth. To acquire a myocardial perfusion study, the patient reclines on a chair
with the right angle gantry positioned over the chest. A fast scout scan is performed to determine the
location of the heart so that the CZT detector modules can be oriented appropriately. This system is
reported to have substantially higher count sensitivity than a conventional SPECT system with a
twofold improvement in spatial resolution. 18
11.3.4 SPECT CT
There are several limitations associated with SPECT imaging. Accurate and artifact-free SPECT
images require correction for attenuation, and as noted above, that requires obtaining attenuation
maps of the image volume. Another problem with SPECT is its poor spatial limitation and lack of
anatomical landmarks for unambiguously locating abnormal areas. Combining SPECT imaging with
CT imaging addresses both of these concerns. 19 The combination of SPECT and CT in a single
20
device was first investigated by Hasegawa et al., but the recent introduction of commercial SPECT
CT systems is likely mostly the result of the success of PET CT. There are at least three different
SPECT CT systems that are available today and a sample SPECT CT study (Fig. 11.10).