
Page 30 - Cam Design Handbook
P. 30
THB1 8/15/03 2:42 PM Page 18
18 CAM DESIGN HANDBOOK
. 360 deg.
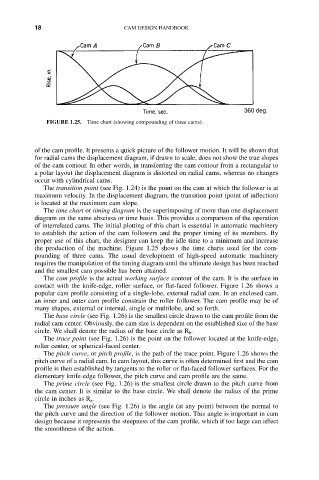
FIGURE 1.25. Time chart (showing compounding of three cams).
of the cam profile. It presents a quick picture of the follower motion. It will be shown that
for radial cams the displacement diagram, if drawn to scale, does not show the true slopes
of the cam contour. In other words, in transferring the cam contour from a rectangular to
a polar layout the displacement diagram is distorted on radial cams, whereas no changes
occur with cylindrical cams.
The transition point (see Fig. 1.24) is the point on the cam at which the follower is at
maximum velocity. In the displacement diagram, the transition point (point of inflection)
is located at the maximum cam slope.
The time chart or timing diagram is the superimposing of more than one displacement
diagram on the same abscissa or time basis. This provides a comparison of the operation
of interrelated cams. The initial plotting of this chart is essential in automatic machinery
to establish the action of the cam followers and the proper timing of its members. By
proper use of this chart, the designer can keep the idle time to a minimum and increase
the production of the machine. Figure 1.25 shows the time charts used for the com-
pounding of three cams. The usual development of high-speed automatic machinery
requires the manipulation of the timing diagram until the ultimate design has been reached
and the smallest cam possible has been attained.
The cam profile is the actual working surface contour of the cam. It is the surface in
contact with the knife-edge, roller surface, or flat-faced follower. Figure 1.26 shows a
popular cam profile consisting of a single-lobe, external radial cam. In an enclosed cam,
an inner and outer cam profile constrain the roller follower. The cam profile may be of
many shapes, external or internal, single or multilobe, and so forth.
The base circle (see Fig. 1.26) is the smallest circle drawn to the cam profile from the
radial cam center. Obviously, the cam size is dependent on the established size of the base
circle. We shall denote the radius of the base circle as R b.
The trace point (see Fig. 1.26) is the point on the follower located at the knife-edge,
roller center, or spherical-faced center.
The pitch curve, or pitch profile, is the path of the trace point. Figure 1.26 shows the
pitch curve of a radial cam. In cam layout, this curve is often determined first and the cam
profile is then established by tangents to the roller or flat-faced follower surfaces. For the
elementary knife-edge follower, the pitch curve and cam profile are the same.
The prime circle (see Fig. 1.26) is the smallest circle drawn to the pitch curve from
the cam center. It is similar to the base circle. We shall denote the radius of the prime
circle in inches as R a .
The pressure angle (see Fig. 1.26) is the angle (at any point) between the normal to
the pitch curve and the direction of the follower motion. This angle is important in cam
design because it represents the steepness of the cam profile, which if too large can affect
the smoothness of the action.