
Page 298 - Color Atlas of Biochemistry
P. 298
Blood 289
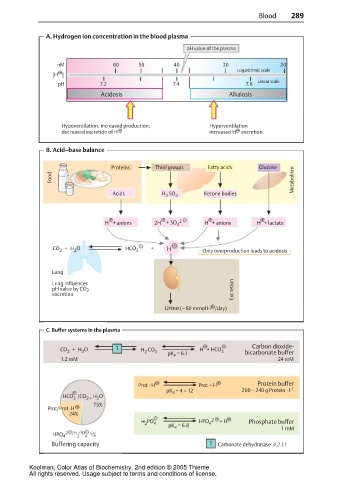
A. Hydrogen ion concentration in the blood plasma
pH value of the plasma
nM 60 50 40 30 20
Logarithmic scale
[H ]
Linear scale
pH 7.2 7.4 7.6
Acidosis Alkalosis
Hypoventilation, increased production, Hyperventilation
decreased excretion of H increased H excretion
B. Acid–base balance
Proteins Thiol groups Fatty acids Glucose
Food Metabolism
Acids H SO Ketone bodies
2 4
H + anions 2H + SO 4 2 H + anions H + lactate
CO + H O HCO 3 + H Only overproduction leads to acidosis
2
2
Lung
Lung influences
pH value by CO 2 Excretion
excretion
Urine ( 60 mmol H /day)
~
C. Buffer systems in the plasma
CO + H O 1 H CO 3 H + HCO 3 Carbon dioxide-
2
2
2
pK a = 6.1 bicarbonate buffer
1.2 mM 24 mM
Prot · H Prot + H Protein buffer
pK a = 4 – 12 200 – 240 g Protein · l -1
H O
HCO /CO 2 + 2
3
75%
Prot/Prot· H
24%
H PO 4 HPO 4 2 + H Phosphate buffer
2
pK a = 6.8
1 mM
HPO 4 2 /H PO 4 1%
2
Buffering capacity 1 Carbonate dehydratase 4.2.1.1
Koolman, Color Atlas of Biochemistry, 2nd edition © 2005 Thieme
All rights reserved. Usage subject to terms and conditions of license.