
Page 28 - Computational Fluid Dynamics for Engineers
P. 28
1.2 Prediction of the Maximum Lift Coefficient of Multielement Wings 13
-9 PRESSURE DIFFERENCE RULE
-8
" ^ - ^ CLMAX=1.04
-7
AC D
-6
-5
-4
-3
-2
-1
0
0.0 0.2 0.4 0.6 0.8 1.0
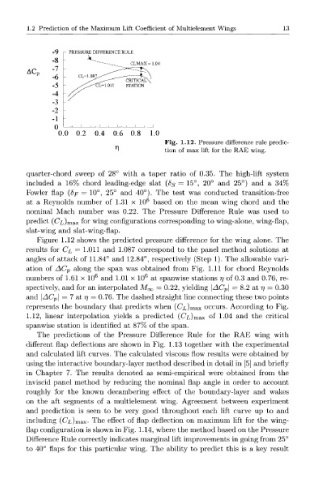
Fig. 1.12. Pressure difference rule predic-
tion of max lift for the RAE wing.
quarter-chord sweep of 28° with a taper ratio of 0.35. The high-lift system
included a 16% chord leading-edge slat (S s = 15°, 20° and 25°) and a 34%
Fowler flap (<5p = 10°, 25° and 40°). The test was conducted transition-free
6
at a Reynolds number of 1.31 x 10 based on the mean wing chord and the
nominal Mach number was 0.22. The Pressure Difference Rule was used to
predict (Cz,)max for wing configurations corresponding to wing-alone, wing-flap,
slat-wing and slat-wing-flap.
Figure 1.12 shows the predicted pressure difference for the wing alone. The
results for CL = 1.011 and 1.087 correspond to the panel method solutions at
angles of attack of 11.84° and 12.84°, respectively (Step 1). The allowable vari-
ation of AC P along the span was obtained from Fig. 1.11 for chord Reynolds
numbers of 1.61 x 10 6 and 1.01 x 10 6 at spanwise stations rj of 0.3 and 0.76, re-
spectively, and for an interpolated M^ = 0.22, yielding |^AC P| = 8.2 at rj = 0.30
and \AC P\ = 7 at 77 = 0.76. The dashed straight line connecting these two points
represents the boundary that predicts when (C7,)max occurs. According to Fig.
1.12, linear interpolation yields a predicted (C/^max of 1.04 and the critical
spanwise station is identified at 87% of the span.
The predictions of the Pressure Difference Rule for the RAE wing with
different flap deflections are shown in Fig. 1.13 together with the experimental
and calculated lift curves. The calculated viscous flow results were obtained by
using the interactive boundary-layer method described in detail in [5] and briefly
in Chapter 7. The results denoted as semi-empirical were obtained from the
inviscid panel method by reducing the nominal flap angle in order to account
roughly for the known decambering effect of the boundary-layer and wakes
on the aft segments of a multielement wing. Agreement between experiment
and prediction is seen to be very good throughout each lift curve up to and
including (CL)max- The effect of flap deflection on maximum lift for the wing-
flap configuration is shown in Fig. 1.14, where the method based on the Pressure
Difference Rule correctly indicates marginal lift improvements in going from 25°
to 40° flaps for this particular wing. The ability to predict this is a key result