
Page 29 - Computational Fluid Dynamics for Engineers
P. 29
14 1. Introduction
3.0
2.5
FLAP ANGLE = 40°
2.0
1.5
^_ # CLEAN WING
1.0 o o 0 o
0.5
EXPERIMENTAL
VISCOUS
0.0 o*> SEMI-EMPIRICAL
PREDICTED CLMAX
-0.5 J _ J_ J
-4-2 0 2 4 6 8 10121416
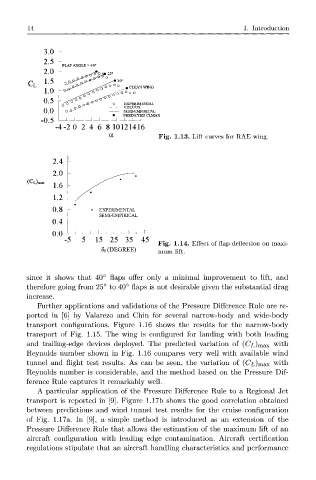
a F i g . 1.13. Lift curves for R A E wing.
2.4
2.0
(C L) m
1.6
1.2
0.8 EXPERIMENTAL
SEMI-EMPIRICAL
0.4
0.0 A i 1 .. 1....J.. J.....J
-5 15 25 35 45
Fig. 1.14. Effect of flap deflection on maxi-
8f (DEGREE) mum lift.
since it shows that 40° flaps offer only a minimal improvement to lift, and
therefore going from 25° to 40° flaps is not desirable given the substantial drag
increase.
Further applications and validations of the Pressure Difference Rule are re-
ported in [6] by Valarezo and Chin for several narrow-body and wide-body
transport configurations. Figure 1.16 shows the results for the narrow-body
transport of Fig. 1.15. The wing is configured for landing with both leading
and trailing-edge devices deployed. The predicted variation of (C£) m a x with
Reynolds number shown in Fig. 1.16 compares very well with available wind
(
tunnel and flight test results. As can be seen, the variation of Cx) m a x with
Reynolds number is considerable, and the method based on the Pressure Dif-
ference Rule captures it remarkably well.
A particular application of the Pressure Difference Rule to a Regional Jet
transport is reported in [9]. Figure 1.17b shows the good correlation obtained
between predictions and wind tunnel test results for the cruise configuration
of Fig. 1.17a. In [9], a simple method is introduced as an extension of the
Pressure Difference Rule that allows the estimation of the maximum lift of an
aircraft configuration with leading edge contamination. Aircraft certification
regulations stipulate that an aircraft handling characteristics and performance