
Page 31 - Computational Fluid Dynamics for Engineers
P. 31
16 1. Introduction
(a) (b)
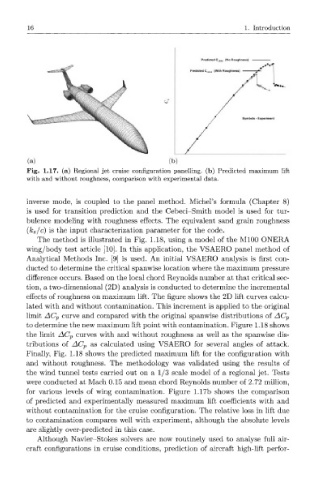
Fig. 1.17. (a) Regional jet cruise configuration panelling, (b) Predicted maximum lift
with and without roughness, comparison with experimental data.
inverse mode, is coupled to the panel method. Michel's formula (Chapter 8)
is used for transition prediction and the Cebeci-Smith model is used for tur-
bulence modeling with roughness effects. The equivalent sand grain roughness
(k s/c) is the input characterization parameter for the code.
The method is illustrated in Fig. 1.18, using a model of the M100 ONERA
wing/body test article [10]. In this application, the VSAERO panel method of
Analytical Methods Inc. [9] is used. An initial VSAERO analysis is first con-
ducted to determine the critical spanwise location where the maximum pressure
difference occurs. Based on the local chord Reynolds number at that critical sec-
tion, a two-dimensional (2D) analysis is conducted to determine the incremental
effects of roughness on maximum lift. The figure shows the 2D lift curves calcu-
lated with and without contamination. This increment is applied to the original
limit AC P curve and compared with the original spanwise distributions of AC p
to determine the new maximum lift point with contamination. Figure 1.18 shows
the limit AC P curves with and without roughness as well as the spanwise dis-
tributions of AC P as calculated using VSAERO for several angles of attack.
Finally, Fig. 1.18 shows the predicted maximum lift for the configuration with
and without roughness. The methodology was validated using the results of
the wind tunnel tests carried out on a 1/3 scale model of a regional jet. Tests
were conducted at Mach 0.15 and mean chord Reynolds number of 2.72 million,
for various levels of wing contamination. Figure 1.17b shows the comparison
of predicted and experimentally measured maximum lift coefficients with and
without contamination for the cruise configuration. The relative loss in lift due
to contamination compares well with experiment, although the absolute levels
are slightly over-predicted in this case.
Although Navier-Stokes solvers are now routinely used to analyse full air-
craft configurations in cruise conditions, prediction of aircraft high-lift perfor-