
Page 24 - Computational Fluid Dynamics for Engineers
P. 24
1.1 Skin-Friction Drag Reduction 9
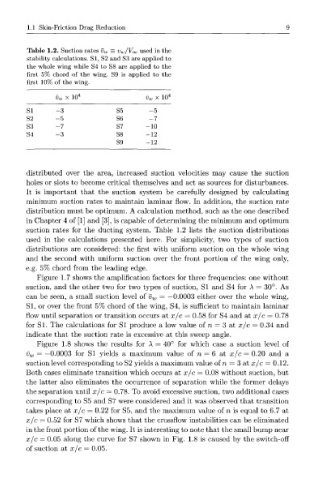
Table 1.2. Suction rates v w = v^/V^ used in the
stability calculations. SI, S2 and S3 are applied to
the whole wing while S4 to S8 are applied to the
first 5% chord of the wing. S9 is applied to the
first 10% of the wing.
v w x 10 4 v w x 10 4
51 - 3 S5 - 5
52 - 5 S6 - 7
53 - 7 S7 -10
54 - 3 S8 -12
S9 -12
distributed over the area, increased suction velocities may cause the suction
holes or slots to become critical themselves and act as sources for disturbances.
It is important that the suction system be carefully designed by calculating
minimum suction rates to maintain laminar flow. In addition, the suction rate
distribution must be optimum. A calculation method, such as the one described
in Chapter 4 of [1] and [3], is capable of determining the minimum and optimum
suction rates for the ducting system. Table 1.2 lists the suction distributions
used in the calculations presented here. For simplicity, two types of suction
distributions are considered: the first with uniform suction on the whole wing
and the second with uniform suction over the front portion of the wing only,
e.g. 5% chord from the leading edge.
Figure 1.7 shows the amplification factors for three frequencies: one without
suction, and the other two for two types of suction, SI and S4 for A = 30°. As
can be seen, a small suction level of v w = —0.0003 either over the whole wing,
SI, or over the front 5% chord of the wing, S4, is sufficient to maintain laminar
flow until separation or transition occurs at x/c — 0.58 for S4 and at x/c = 0.78
for SI. The calculations for SI produce a low value of n — 3 at x/c — 0.34 and
indicate that the suction rate is excessive at this sweep angle.
Figure 1.8 shows the results for A = 40° for which case a suction level of
v w — —0.0003 for SI yields a maximum value of n = 6 at x/c = 0.20 and a
suction level corresponding to S2 yields a maximum value of n = 3 at x/c = 0.12.
Both cases eliminate transition which occurs at x/c = 0.08 without suction, but
the latter also eliminates the occurrence of separation while the former delays
the separation until x/c = 0.78. To avoid excessive suction, two additional cases
corresponding to S5 and S7 were considered and it was observed that transition
takes place at x/c = 0.22 for S5, and the maximum value of n is equal to 6.7 at
x/c = 0.52 for S7 which shows that the crossflow instabilities can be eliminated
in the front portion of the wing. It is interesting to note that the small bump near
x/c = 0.05 along the curve for S7 shown in Fig. 1.8 is caused by the switch-off
of suction at x/c = 0.05.