
Page 128 - Computational Modeling in Biomedical Engineering and Medical Physics
P. 128
Electrical activity of the heart 117
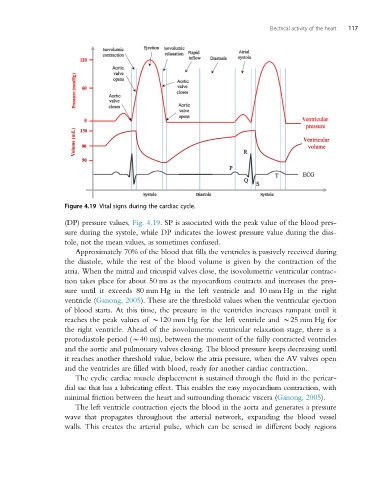
Figure 4.19 Vital signs during the cardiac cycle.
(DP) pressure values, Fig. 4.19. SP is associated with the peak value of the blood pres-
sure during the systole, while DP indicates the lowest pressure value during the dias-
tole, not the mean values, as sometimes confused.
Approximately 70% of the blood that fills the ventricles is passively received during
the diastole, while the rest of the blood volume is given by the contraction of the
atria. When the mitral and tricuspid valves close, the isovolumetric ventricular contrac-
tion takes place for about 50 ms as the myocardium contracts and increases the pres-
sure until it exceeds 80 mm Hg in the left ventricle and 10 mm Hg in the right
ventricle (Ganong, 2005). These are the threshold values when the ventricular ejection
of blood starts. At this time, the pressure in the ventricles increases rampant until it
reaches the peak values of B120 mm Hg for the left ventricle and B25 mm Hg for
the right ventricle. Ahead of the isovolumetric ventricular relaxation stage, there is a
protodiastole period (B40 ms), between the moment of the fully contracted ventricles
and the aortic and pulmonary valves closing. The blood pressure keeps decreasing until
it reaches another threshold value, below the atria pressure, when the AV valves open
and the ventricles are filled with blood, ready for another cardiac contraction.
The cyclic cardiac muscle displacement is sustained through the fluid in the pericar-
dial sac that has a lubricating effect. This enables the easy myocardium contraction, with
minimal friction between the heart and surrounding thoracic viscera (Ganong, 2005).
The left ventricle contraction ejects the blood in the aorta and generates a pressure
wave that propagates throughout the arterial network, expanding the blood vessel
walls. This creates the arterial pulse, which can be sensed in different body regions