
Page 133 - Computational Modeling in Biomedical Engineering and Medical Physics
P. 133
122 Computational Modeling in Biomedical Engineering and Medical Physics
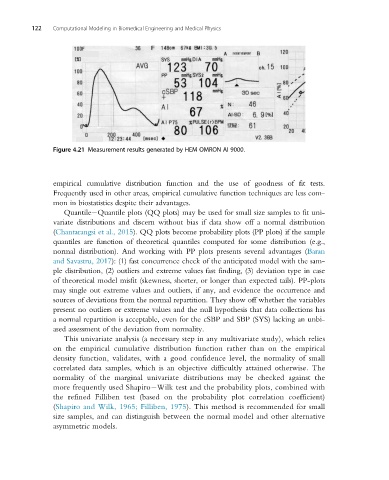
Figure 4.21 Measurement results generated by HEM OMRON AI 9000.
empirical cumulative distribution function and the use of goodness of fit tests.
Frequently used in other areas, empirical cumulative function techniques are less com-
mon in biostatistics despite their advantages.
Quantile Quantile plots (QQ plots) may be used for small size samples to fit uni-
variate distributions and discern without bias if data show off a normal distribution
(Chantarangsi et al., 2015). QQ plots become probability plots (PP plots) if the sample
quantiles are function of theoretical quantiles computed for some distribution (e.g.,
normal distribution). And working with PP plots presents several advantages (Baran
and Savastru, 2017): (1) fast concurrence check of the anticipated model with the sam-
ple distribution, (2) outliers and extreme values fast finding, (3) deviation type in case
of theoretical model misfit (skewness, shorter, or longer than expected tails). PP-plots
may single out extreme values and outliers, if any, and evidence the occurrence and
sources of deviations from the normal repartition. They show off whether the variables
present no outliers or extreme values and the null hypothesis that data collections has
a normal repartition is acceptable, even for the cSBP and SBP (SYS) lacking an unbi-
ased assessment of the deviation from normality.
This univariate analysis (a necessary step in any multivariate study), which relies
on the empirical cumulative distribution function rather than on the empirical
density function, validates, with a good confidence level, the normality of small
correlated data samples, which is an objective difficultly attained otherwise. The
normality of the marginal univariate distributions may be checked against the
more frequently used Shapiro Wilk test and the probability plots, combined with
the refined Filliben test (based on the probability plot correlation coefficient)
(Shapiro and Wilk, 1965; Filliben, 1975). This method is recommended for small
size samples, and can distinguish between the normal model and other alternative
asymmetric models.