
Page 160 - Computational Modeling in Biomedical Engineering and Medical Physics
P. 160
Bioimpedance methods 149
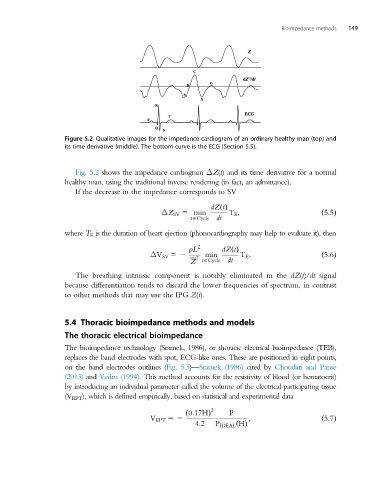
Figure 5.2 Qualitative images for the impedance cardiogram of an ordinary healthy man (top) and
its time derivative (middle). The bottom curve is the ECG (Section 5.5).
Fig. 5.2 shows the impedance cardiogram ΔZ(t) and its time derivative for a normal
healthy man, using the traditional inverse rendering (in fact, an admittance).
If the decrease in the impedance corresponds to SV
dZ tðÞ
ΔZ SV 5 min T E ; ð5:5Þ
tACycle dt
where T E is the duration of heart ejection (phonocardiography may help to evaluate it), then
ρL 2 dZ tðÞ
ΔV SV 52 2 min T E : ð5:6Þ
Z tACycle dt
The breathing intrinsic component is notably eliminated in the dZ(t)/dt signal
because differentiation tends to discard the lower frequencies of spectrum, in contrast
to other methods that may use the IPG Z(t).
5.4 Thoracic bioimpedance methods and models
The thoracic electrical bioimpedance
The bioimpedance technology (Sramek, 1986), or thoracic electrical bioimpedance (TEB),
replaces the band electrodes with spot, ECG-like ones. These are positioned in eight points,
on the band electrodes outlines (Fig. 5.3)—Sramek (1986) cited by Choudari and Panse
(2013) and Vedru (1994). This method accounts for the resistivity of blood (or hematocrit)
by introducing an individual parameter called the volume of the electrical participating tissue
(V EPT ), which is defined empirically, based on statistical and experimental data
3
ð 0:17HÞ P
V EPT 52 ; ð5:7Þ
4:2 P IDEAL HðÞ