
Page 165 - Computational Modeling in Biomedical Engineering and Medical Physics
P. 165
154 Computational Modeling in Biomedical Engineering and Medical Physics
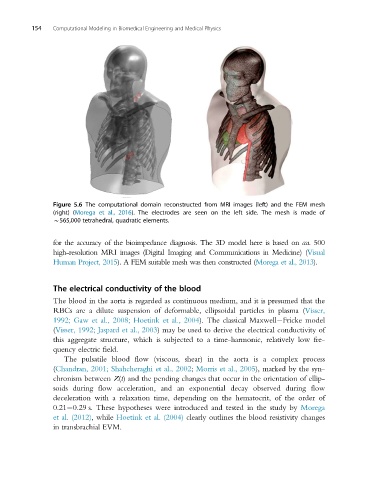
Figure 5.6 The computational domain reconstructed from MRI images (left) and the FEM mesh
(right) (Morega et al., 2016). The electrodes are seen on the left side. The mesh is made of
B565,000 tetrahedral, quadratic elements.
for the accuracy of the bioimpedance diagnosis. The 3D model here is based on cca.500
high-resolution MRI images (Digital Imaging and Communications in Medicine) (Visual
Human Project, 2015). A FEM suitable mesh was then constructed (Morega et al., 2013).
The electrical conductivity of the blood
The blood in the aorta is regarded as continuous medium, and it is presumed that the
RBCs are a dilute suspension of deformable, ellipsoidal particles in plasma (Visser,
1992; Gaw et al., 2008; Hoetink et al., 2004). The classical Maxwell Fricke model
(Visser, 1992; Jaspard et al., 2003) may be used to derive the electrical conductivity of
this aggregate structure, which is subjected to a time-harmonic, relatively low fre-
quency electric field.
The pulsatile blood flow (viscous, shear) in the aorta is a complex process
(Chandran, 2001; Shahcheraghi et al., 2002; Morris et al., 2005), marked by the syn-
chronism between Z(t) and the pending changes that occur in the orientation of ellip-
soids during flow acceleration, and an exponential decay observed during flow
deceleration with a relaxation time, depending on the hematocrit, of the order of
0.21 0.29 s. These hypotheses were introduced and tested in the study by Morega
et al. (2012), while Hoetink et al. (2004) clearly outlines the blood resistivity changes
in transbrachial EVM.