Page 307 - Computational Statistics Handbook with MATLAB
P. 307

296                        Computational Statistics Handbook with MATLAB


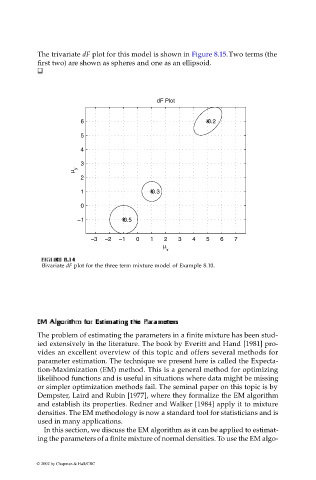
                             The trivariate dF plot for this model is shown in Figure 8.15. Two terms (the
                             first two) are shown as spheres and one as an ellipsoid.


                                                              dF Plot


                                         6                                  0.2
                                         5

                                         4
                                         3
                                       µ y
                                         2

                                         1                  0.3
                                         0

                                        −1           0.5

                                           −3  −2  −1   0   1   2   3   4   5   6   7
                                                                µ
                                                                 x
                               IG
                              FI F U URE G 8.14  RE 8.14
                                  8.14
                               GU
                              F F II  GU  RE RE 8.14
                              Bivariate dF plot for the three term mixture model of Example 8.10.


                                                     gt
                                                     gg
                                                       thth
                                                   g
                             EAMA
                                                mm aatt
                                                   ti inin
                                                       th
                             EEMAMA
                             EM l  ll lggoor  rithmithm for for for  Esti EEstisti stim  ma  at  nin  h  e  ee  Pa ar  raamme  et  teer eerr ss
                                                                   rss
                                                          PPaarr aamm eett
                                                        eP
                                     for
                                  ggoorr ithmithm E
                             The problem of estimating the parameters in a finite mixture has been stud-
                             ied extensively in the literature. The book by Everitt and Hand [1981] pro-
                             vides an excellent overview of this topic and offers several methods for
                             parameter estimation. The technique we present here is called the Expecta-
                             tion-Maximization (EM) method. This is a general method for optimizing
                             likelihood functions and is useful in situations where data might be missing
                             or simpler optimization methods fail. The seminal paper on this topic is by
                             Dempster, Laird and Rubin [1977], where they formalize the EM algorithm
                             and establish its properties. Redner and Walker [1984] apply it to mixture
                             densities. The EM methodology is now a standard tool for statisticians and is
                             used in many applications.
                              In this section, we discuss the EM algorithm as it can be applied to estimat-
                             ing the parameters of a finite mixture of normal densities. To use the EM algo-
                            © 2002 by Chapman & Hall/CRC
   302   303   304   305   306   307   308   309   310   311   312