
Page 101 - Corrosion Engineering Principles and Practice
P. 101
76 C h a p t e r 4 C o r r o s i o n T h e r m o d y n a m i c s 77
2
1.5 O + 4H + 4e = 2H O
+
–
2
2
b
1
O
2
Potential (V vs. SHE) –0.5 0 2H + 2e = H 2 OH + H = H O
0.5
–
+
2
a
+
–
2
–1 H
–1.5
–2
–2 0 2 4 6 8 10 12 14 16
pH
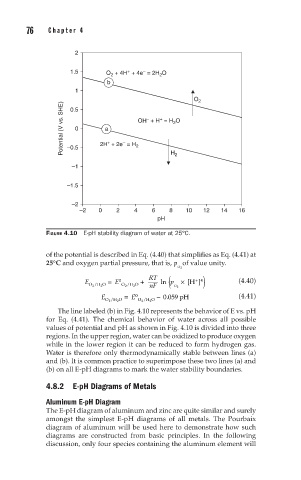
FIGURE 4.10 E-pH stability diagram of water at 25°C.
of the potential is described in Eq. (4.40) that simplifies as Eq. (4.41) at
25°C and oxygen partial pressure, that is, p of value unity.
O 2
)
E O /H O = E 0 O /H O + RT ln ( p O 2 × [H ] 4 (4.40)
+
nF
2
2
2
2
E = E 0 − 0.059 pH (4.41)
O /H O O /H O
2
2
2
2
The line labeled (b) in Fig. 4.10 represents the behavior of E vs. pH
for Eq. (4.41). The chemical behavior of water across all possible
values of potential and pH as shown in Fig. 4.10 is divided into three
regions. In the upper region, water can be oxidized to produce oxygen
while in the lower region it can be reduced to form hydrogen gas.
Water is therefore only thermodynamically stable between lines (a)
and (b). It is common practice to superimpose these two lines (a) and
(b) on all E-pH diagrams to mark the water stability boundaries.
4.8.2 E-pH Diagrams of Metals
Aluminum E-pH Diagram
The E-pH diagram of aluminum and zinc are quite similar and surely
amongst the simplest E-pH diagrams of all metals. The Pourbaix
diagram of aluminum will be used here to demonstrate how such
diagrams are constructed from basic principles. In the following
discussion, only four species containing the aluminum element will