
Page 96 - Corrosion Engineering Principles and Practice
P. 96
70 C h a p t e r 4 C o r r o s i o n T h e r m o d y n a m i c s 71
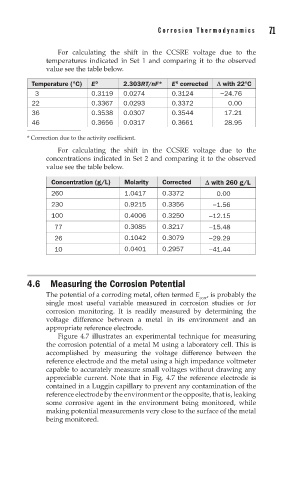
For calculating the shift in the CCSRE voltage due to the
temperatures indicated in Set 1 and comparing it to the observed
value see the table below.
Temperature (°C) E 0 2.303RT/nF* E corrected D with 22°C
0
3 0.3119 0.0274 0.3124 −24.76
22 0.3367 0.0293 0.3372 0.00
36 0.3538 0.0307 0.3544 17.21
46 0.3656 0.0317 0.3661 28.95
* Correction due to the activity coefficient.
For calculating the shift in the CCSRE voltage due to the
concentrations indicated in Set 2 and comparing it to the observed
value see the table below.
Concentration (g/L) Molarity Corrected D with 260 g/L
260 1.0417 0.3372 0.00
230 0.9215 0.3356 −1.56
100 0.4006 0.3250 −12.15
77 0.3085 0.3217 −15.48
26 0.1042 0.3079 −29.29
10 0.0401 0.2957 −41.44
4.6 Measuring the Corrosion Potential
The potential of a corroding metal, often termed E corr , is probably the
single most useful variable measured in corrosion studies or for
corrosion monitoring. It is readily measured by determining the
voltage difference between a metal in its environment and an
appropriate reference electrode.
Figure 4.7 illustrates an experimental technique for measuring
the corrosion potential of a metal M using a laboratory cell. This is
accomplished by measuring the voltage difference between the
reference electrode and the metal using a high impedance voltmeter
capable to accurately measure small voltages without drawing any
appreciable current. Note that in Fig. 4.7 the reference electrode is
contained in a Luggin capillary to prevent any contamination of the
reference electrode by the environment or the opposite, that is, leaking
some corrosive agent in the environment being monitored, while
making potential measurements very close to the surface of the metal
being monitored.