
Page 99 - Corrosion Engineering Principles and Practice
P. 99
74 C h a p t e r 4 C o r r o s i o n T h e r m o d y n a m i c s 75
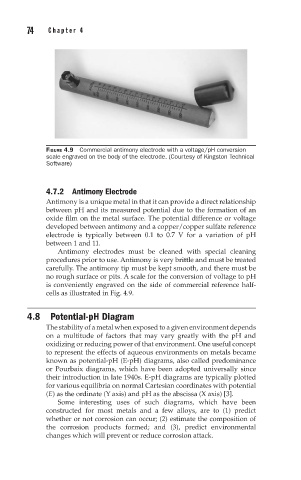
FIGURE 4.9 Commercial antimony electrode with a voltage/pH conversion
scale engraved on the body of the electrode. (Courtesy of Kingston Technical
Software)
4.7.2 Antimony Electrode
Antimony is a unique metal in that it can provide a direct relationship
between pH and its measured potential due to the formation of an
oxide film on the metal surface. The potential difference or voltage
developed between antimony and a copper/copper sulfate reference
electrode is typically between 0.1 to 0.7 V for a variation of pH
between 1 and 11.
Antimony electrodes must be cleaned with special cleaning
procedures prior to use. Antimony is very brittle and must be treated
carefully. The antimony tip must be kept smooth, and there must be
no rough surface or pits. A scale for the conversion of voltage to pH
is conveniently engraved on the side of commercial reference half-
cells as illustrated in Fig. 4.9.
4.8 Potential-pH Diagram
The stability of a metal when exposed to a given environment depends
on a multitude of factors that may vary greatly with the pH and
oxidizing or reducing power of that environment. One useful concept
to represent the effects of aqueous environments on metals became
known as potential-pH (E-pH) diagrams, also called predominance
or Pourbaix diagrams, which have been adopted universally since
their introduction in late 1940s. E-pH diagrams are typically plotted
for various equilibria on normal Cartesian coordinates with potential
(E) as the ordinate (Y axis) and pH as the abscissa (X axis) [3].
Some interesting uses of such diagrams, which have been
constructed for most metals and a few alloys, are to (1) predict
whether or not corrosion can occur; (2) estimate the composition of
the corrosion products formed; and (3), predict environmental
changes which will prevent or reduce corrosion attack.