Page 105 - Corrosion Engineering Principles and Practice
P. 105

80     C h a p t e r   4                                                                                                   C o r r o s i o n   T h e r m o d y n a m i c s    81


                              2

                             1.5    Al 3+                             AlO 2 –
                                    b                 10 –6  10 –4  10 –2  10 0
                              1       10 –2 0
                                       10
                           Potential (V vs. SHE)  –0.5 0  a  10 –6  Al 2 O ·H O
                                        –4
                             0.5
                                      10
                                                           3
                                                             2


                             –1
                            –1.5

                                        AI
                             –2
                                –2   0   2    4    6    8   10   12  14   16
                                                     pH
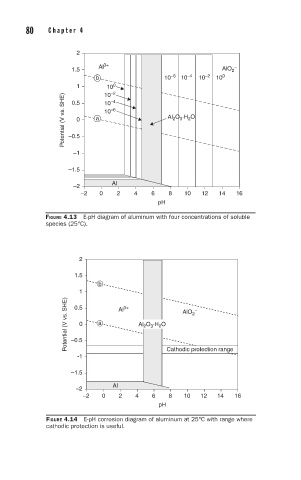
                      FIGURE 4.13  E-pH diagram of aluminum with four concentrations of soluble
                      species (25°C).


                               2
                              1.5
                                    b
                               1           3+
                            Potential (V vs. SHE)  –0.5  a  Al  Al O ·H O  AlO 2 –
                              0.5

                               0
                                                     2
                                                 2
                                                   3
                               -1                      Cathodic protection range

                             –1.5
                                        Al
                              –2
                                –2   0    2    4   6    8   10  12   14   16
                                                     pH
                      FIGURE 4.14  E-pH corrosion diagram of aluminum at 25°C with range where
                      cathodic protection is useful.
   100   101   102   103   104   105   106   107   108   109   110