
Page 108 - Corrosion Engineering Principles and Practice
P. 108
82 C h a p t e r 4 C o r r o s i o n T h e r m o d y n a m i c s 83
2
1.5
b
1 Fe 3+
Fe(OH) 3
2+
Fe
Potential (V vs. SHE) –0.5 0 a 10 –2 HFeO 2 –
0
10
0.5
–4
10
–6
10
–1 Fe(OH) 2
–1.5
Fe
–2
–2 0 2 4 6 8 10 12 14 16
pH
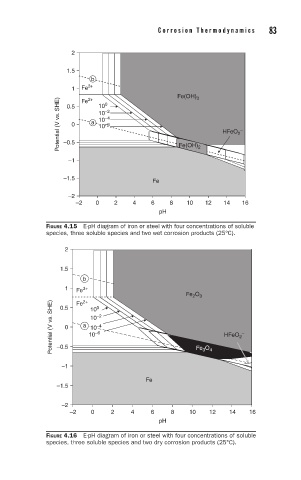
FIGURE 4.15 E-pH diagram of iron or steel with four concentrations of soluble
species, three soluble species and two wet corrosion products (25°C).
2
1.5
b
1 Fe 3+
Fe O 3
2
2+
Potential (V vs. SHE) –0.5 0 a 10 –6 HFeO 2 –
Fe
0.5
0
10
–2
10
–4
10
3
–1 Fe O 4
Fe
–1.5
–2
–2 0 2 4 6 8 10 12 14 16
pH
FIGURE 4.16 E-pH diagram of iron or steel with four concentrations of soluble
species, three soluble species and two dry corrosion products (25°C).