
Page 334 - Decision Making Applications in Modern Power Systems
P. 334
Decision-making-based optimal generation-side Chapter | 11 295
(A)
0.04
hGSA-PS w/o EV
ICA with EV (proposed)
0.02 ICA w/o EV
DE algorithm w/o EV
Δf 2 (Hz) 0
–0.02
–0.04
–0.06
0 5 10 15 20 25 30
Time (s)
(B)
0.01
hGSA w/o EV
ICA with EV (proposed)
0.005 ICA w/o EV
ΔP tie1–2 (p.u.) –0.005 0
DE algorithm w/o EV
–0.01
–0.015
0 5 10 15 20 25 30
Time (s)
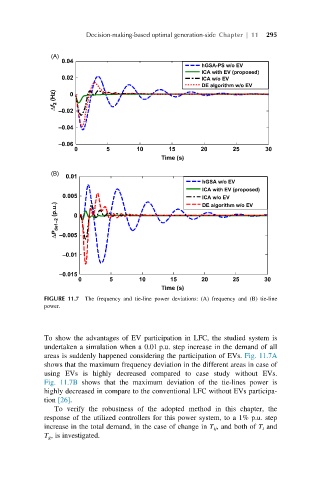
FIGURE 11.7 The frequency and tie-line power deviations: (A) frequency and (B) tie-line
power.
To show the advantages of EV participation in LFC, the studied system is
undertaken a simulation when a 0.01 p.u. step increase in the demand of all
areas is suddenly happened considering the participation of EVs. Fig. 11.7A
shows that the maximum frequency deviation in the different areas in case of
using EVs is highly decreased compared to case study without EVs.
Fig. 11.7B shows that the maximum deviation of the tie-lines power is
highly decreased in compare to the conventional LFC without EVs participa-
tion [26].
To verify the robustness of the adopted method in this chapter, the
response of the utilized controllers for this power system, to a 1% p.u. step
increase in the total demand, in the case of change in T ij , and both of T t and
T g , is investigated.