
Page 101 - Defrosting for Air Source Heat Pump
P. 101
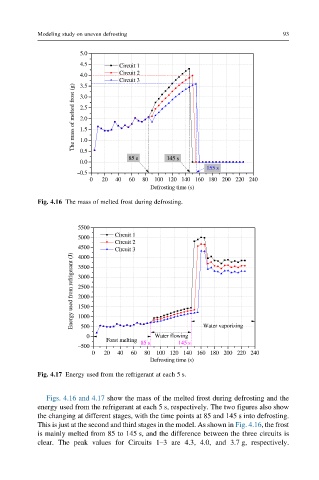
Modeling study on uneven defrosting                                93


                       5.0
                       4.5        Circuit 1
                       4.0        Circuit 2
                                  Circuit 3
                       3.5
                     The mass of melted frost (g)  2.5
                       3.0


                       2.0
                       1.5
                       1.0
                       0.5
                                    85 s      145 s
                       0.0
                                                         155 s
                      –0.5
                         0   20  40  60  80  100 120 140 160 180 200 220 240
                                          Defrosting time (s)

           Fig. 4.16 The mass of melted frost during defrosting.


                      5500
                      5000       Circuit 1
                                 Circuit 2
                      4500       Circuit 3
                     Energy used from refrigerant (J)  3000
                      4000
                      3500

                      2500
                      2000
                      1500
                      1000
                       500
                        0                  Water flowing  Water vaporizing
                              Forst melting  85 s  145 s
                      –500
                          0  20  40  60  80  100 120 140 160 180 200 220 240
                                          Defrosting time (s)

           Fig. 4.17 Energy used from the refrigerant at each 5 s.


              Figs. 4.16 and 4.17 show the mass of the melted frost during defrosting and the
           energy used from the refrigerant at each 5 s, respectively. The two figures also show
           the changing at different stages, with the time points at 85 and 145 s into defrosting.
           This is just at the second and third stages in the model. As shown in Fig. 4.16, the frost
           is mainly melted from 85 to 145 s, and the difference between the three circuits is
           clear. The peak values for Circuits 1–3 are 4.3, 4.0, and 3.7 g, respectively.