
Page 97 - Defrosting for Air Source Heat Pump
P. 97
Modeling study on uneven defrosting 89
0.6
Measured Predicted
0.5
Temperature of melted frost collected ( o C) –0.1
0.4
0.3
0.2
0.1
0.0
–0.2
–0.3
–0.4
100 120 140 160 180 200 220 240 260 280
Time (s)
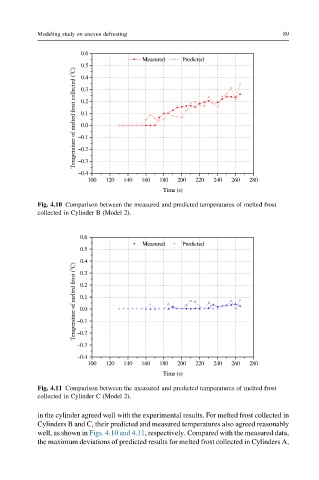
Fig. 4.10 Comparison between the measured and predicted temperatures of melted frost
collected in Cylinder B (Model 2).
0.6
Measured Predicted
0.5
0.4
Temperature of melted frost ( o C) –0.1
0.3
0.2
0.1
0.0
–0.2
–0.3
–0.4
100 120 140 160 180 200 220 240 260 280
Time (s)
Fig. 4.11 Comparison between the measured and predicted temperatures of melted frost
collected in Cylinder C (Model 2).
in the cylinder agreed well with the experimental results. For melted frost collected in
Cylinders B and C, their predicted and measured temperatures also agreed reasonably
well, as shown in Figs. 4.10 and 4.11, respectively. Compared with the measured data,
the maximum deviations of predicted results for melted frost collected in Cylinders A,