
Page 96 - Defrosting for Air Source Heat Pump
P. 96
88 Defrosting for Air Source Heat Pump
28
C1 (Measured) C1 (Predicted)
C2 (Measured) C2 (Predicted)
24
C3 (Measured) C3 (Predicted)
Tube surface temperatures ( o C) 16 8
20
12
0 4
80 90 100 110 120 130 140 150 160 170 180
Time (s)
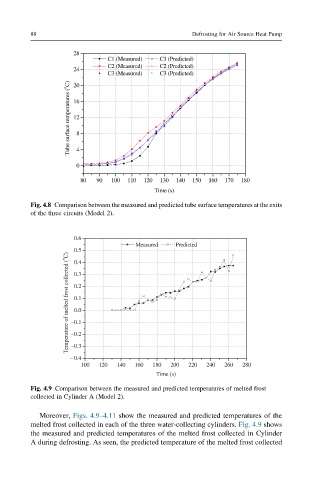
Fig. 4.8 Comparison between the measured and predicted tube surface temperatures at the exits
of the three circuits (Model 2).
0.6
Measured Predicted
0.5
Temperature of melted frost collected ( o C) –0.1
0.4
0.3
0.2
0.1
0.0
–0.2
–0.3
– 0.4
100 120 140 160 180 200 220 240 260 280
Time (s)
Fig. 4.9 Comparison between the measured and predicted temperatures of melted frost
collected in Cylinder A (Model 2).
Moreover, Figs. 4.9–4.11 show the measured and predicted temperatures of the
melted frost collected in each of the three water-collecting cylinders. Fig. 4.9 shows
the measured and predicted temperatures of the melted frost collected in Cylinder
A during defrosting. As seen, the predicted temperature of the melted frost collected