
Page 94 - Defrosting for Air Source Heat Pump
P. 94
86 Defrosting for Air Source Heat Pump
4.2.2 Experimental validation of two models
The validation of the two empirical models developed was carried out by comparing
the experimental data and the predicted data using the models for the key operating
parameters of the experimental ASHP unit, including the tube surface temperature at
the outlet of each circuit, the total mass of melted frost collected, and the defrosting
duration. The experimental data separately reported in the previous section were used
for validation purposes.
4.2.2.1 Validation of Model 1
Model 1 was validated by comparing the predicted defrosting duration, the tube sur-
face temperatures at the exit of each circuit, the temperature variations of the melted
frost collected in Cylinder C, and the total mass of the melted frost collected with the
corresponding experimental data.
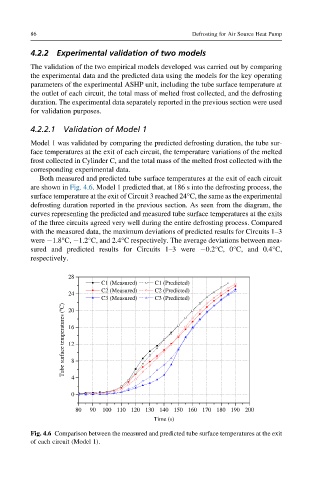
Both measured and predicted tube surface temperatures at the exit of each circuit
are shown in Fig. 4.6. Model 1 predicted that, at 186 s into the defrosting process, the
surface temperature at the exit of Circuit 3 reached 24°C, the same as the experimental
defrosting duration reported in the previous section. As seen from the diagram, the
curves representing the predicted and measured tube surface temperatures at the exits
of the three circuits agreed very well during the entire defrosting process. Compared
with the measured data, the maximum deviations of predicted results for Circuits 1–3
were 1.8°C, 1.2°C, and 2.4°C respectively. The average deviations between mea-
sured and predicted results for Circuits 1–3 were 0.2°C, 0°C, and 0.4°C,
respectively.
28
C1 (Measured) C1 (Predicted)
C2 (Measured) C2 (Predicted)
24
C3 (Measured) C3 (Predicted)
Tube surface temperatures (ºC) 16
20
12
4 8
0
80 90 100 110 120 130 140 150 160 170 180 190 200
Time (s)
Fig. 4.6 Comparison between the measured and predicted tube surface temperatures at the exit
of each circuit (Model 1).