
Page 95 - Defrosting for Air Source Heat Pump
P. 95
Modeling study on uneven defrosting 87
2.1
Measured Predicted
Temperature of melted frost collected ( o C) 1.5
1.8
1.2
0.9
0.6
0.3
100 120 140 160 180 200 220 240 260 280
Time (s)
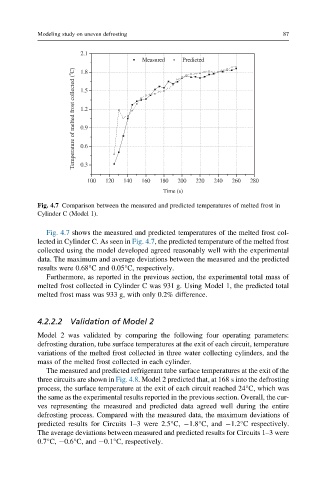
Fig. 4.7 Comparison between the measured and predicted temperatures of melted frost in
Cylinder C (Model 1).
Fig. 4.7 shows the measured and predicted temperatures of the melted frost col-
lected in Cylinder C. As seen in Fig. 4.7, the predicted temperature of the melted frost
collected using the model developed agreed reasonably well with the experimental
data. The maximum and average deviations between the measured and the predicted
results were 0.68°C and 0.05°C, respectively.
Furthermore, as reported in the previous section, the experimental total mass of
melted frost collected in Cylinder C was 931 g. Using Model 1, the predicted total
melted frost mass was 933 g, with only 0.2% difference.
4.2.2.2 Validation of Model 2
Model 2 was validated by comparing the following four operating parameters:
defrosting duration, tube surface temperatures at the exit of each circuit, temperature
variations of the melted frost collected in three water collecting cylinders, and the
mass of the melted frost collected in each cylinder.
The measured and predicted refrigerant tube surface temperatures at the exit of the
three circuits are shown in Fig. 4.8. Model 2 predicted that, at 168 s into the defrosting
process, the surface temperature at the exit of each circuit reached 24°C, which was
the same as the experimental results reported in the previous section. Overall, the cur-
ves representing the measured and predicted data agreed well during the entire
defrosting process. Compared with the measured data, the maximum deviations of
predicted results for Circuits 1–3 were 2.5°C, 1.8°C, and 1.2°C respectively.
The average deviations between measured and predicted results for Circuits 1–3 were
0.7°C, 0.6°C, and 0.1°C, respectively.