
Page 92 - Defrosting for Air Source Heat Pump
P. 92
84 Defrosting for Air Source Heat Pump
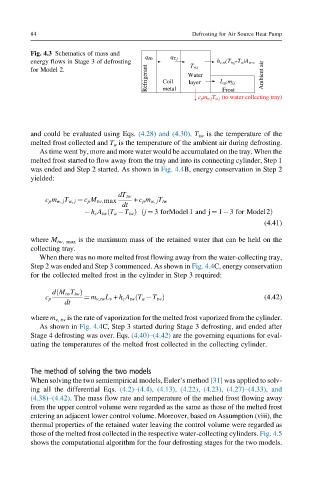
Fig. 4.3 Schematics of mass and
q Me q T,j
energy flows in Stage 3 of defrosting h c,w(T w,j-T a)A w-a
Refrigerant Coil Water L sf,m f,j Ambient air
for Model 2. T w,j
layer
metal
Frost
c pm w,jT w,j (to water collecting tray)
and could be evaluated using Eqs. (4.28) and (4.30). T tw is the temperature of the
melted frost collected and T a is the temperature of the ambient air during defrosting.
As time went by, more and more water would be accumulated on the tray. When the
melted frost started to flow away from the tray and into its connecting cylinder, Step 1
was ended and Step 2 started. As shown in Fig. 4.4B, energy conservation in Step 2
yielded:
dT tw
c p m w, j T w, j ¼ c p M tw,max + c p m w, j T tw
dt
ð
h c A tw T a T tw Þ j ¼ 3 forModel1 and j ¼ 1 3 for Model2Þ
ð
(4.41)
where M tw, max is the maximum mass of the retained water that can be held on the
collecting tray.
When there was no more melted frost flowing away from the water-collecting tray,
Step 2 was ended and Step 3 commenced. As shown in Fig. 4.4C, energy conservation
for the collected melted frost in the cylinder in Step 3 required:
dM tw T tw Þ
ð
ð
c p ¼ m v,tw L v + h c A tw T a T tw Þ (4.42)
dt
where m v, tw is the rate of vaporization for the melted frost vaporized from the cylinder.
As shown in Fig. 4.4C, Step 3 started during Stage 3 defrosting, and ended after
Stage 4 defrosting was over. Eqs. (4.40)–(4.42) are the governing equations for eval-
uating the temperatures of the melted frost collected in the collecting cylinder.
The method of solving the two models
When solving the two semiempirical models, Euler’s method [31] was applied to solv-
ing all the differential Eqs. (4.2)–(4.4), (4.13), (4.22), (4.23), (4.27)–(4.33), and
(4.38)–(4.42). The mass flow rate and temperature of the melted frost flowing away
from the upper control volume were regarded as the same as those of the melted frost
entering an adjacent lower control volume. Moreover, based on Assumption (viii), the
thermal properties of the retained water leaving the control volume were regarded as
those of the melted frost collected in the respective water-collecting cylinders. Fig. 4.5
shows the computational algorithm for the four defrosting stages for the two models.