
Page 99 - Defrosting for Air Source Heat Pump
P. 99
Modeling study on uneven defrosting 91
11
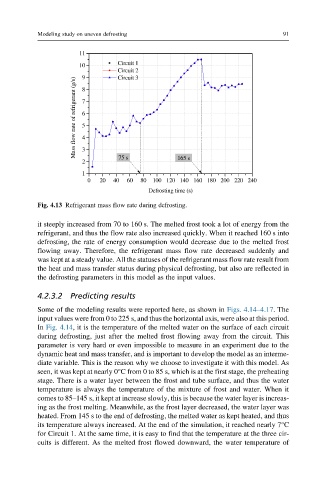
10 Circuit 1
Circuit 2
9
Circuit 3
Mass flow rate of refrigerant (g/s) 7 6 5 4
8
2 3 75 s 165 s
1
0 20 40 60 80 100 120 140 160 180 200 220 240
Defrosting time (s)
Fig. 4.13 Refrigerant mass flow rate during defrosting.
it steeply increased from 70 to 160 s. The melted frost took a lot of energy from the
refrigerant, and thus the flow rate also increased quickly. When it reached 160 s into
defrosting, the rate of energy consumption would decrease due to the melted frost
flowing away. Therefore, the refrigerant mass flow rate decreased suddenly and
was kept at a steady value. All the statuses of the refrigerant mass flow rate result from
the heat and mass transfer status during physical defrosting, but also are reflected in
the defrosting parameters in this model as the input values.
4.2.3.2 Predicting results
Some of the modeling results were reported here, as shown in Figs. 4.14–4.17.The
input values were from 0 to 225 s, and thus the horizontal axis, were also at this period.
In Fig. 4.14, it is the temperature of the melted water on the surface of each circuit
during defrosting, just after the melted frost flowing away from the circuit. This
parameter is very hard or even impossible to measure in an experiment due to the
dynamic heat and mass transfer, and is important to develop the model as an interme-
diate variable. This is the reason why we choose to investigate it with this model. As
seen, it was kept at nearly 0°C from 0 to 85 s, which is at the first stage, the preheating
stage. There is a water layer between the frost and tube surface, and thus the water
temperature is always the temperature of the mixture of frost and water. When it
comes to 85–145 s, it kept at increase slowly, this is because the water layer is increas-
ing as the frost melting. Meanwhile, as the frost layer decreased, the water layer was
heated. From 145 s to the end of defrosting, the melted water as kept heated, and thus
its temperature always increased. At the end of the simulation, it reached nearly 7°C
for Circuit 1. At the same time, it is easy to find that the temperature at the three cir-
cuits is different. As the melted frost flowed downward, the water temperature of