
Page 98 - Defrosting for Air Source Heat Pump
P. 98
90 Defrosting for Air Source Heat Pump
B, and C were 0.084°C, 0.085°C, and 0.068°C, respectively. The average deviations
between measured and predicted results were 0.002°C, 0.002°C, and 0.010°C,
respectively.
Furthermore, using Model 2, the predicted masses of the melted frost collected in
Cylinders A, B, and C were all at 327 g. As reported separately in the previous section,
their corresponding experimental values were 317 g, 328 g, and 324 g, respectively.
Therefore, the largest difference was only at 3% for Cylinder A.
From the comparisons presented above, it was considered that the two empirical
models were experimentally validated, and the validated models can be further used
to quantitatively analyze the defrosting performances of an ASHP unit as discussed in
the following section.
4.2.3 Predicting results by using the validated Model 1
4.2.3.1 Conditions of model extrapolation
As shown in Figs. 4.6 and 4.8, the deviation of tube surface temperature is very small,
and could be accepted. Here, in this work, we used the validated defrosting Model 1,
but changed the input parameters. The refrigerant temperature at the inlet and outlet of
each circuit as well as the refrigerant mass flow rate during defrosting were input into
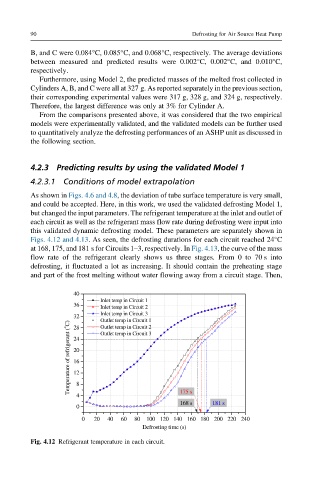
this validated dynamic defrosting model. These parameters are separately shown in
Figs. 4.12 and 4.13. As seen, the defrosting durations for each circuit reached 24°C
at 168, 175, and 181 s for Circuits 1–3, respectively. In Fig. 4.13, the curve of the mass
flow rate of the refrigerant clearly shows us three stages. From 0 to 70 s into
defrosting, it fluctuated a lot as increasing. It should contain the preheating stage
and part of the frost melting without water flowing away from a circuit stage. Then,
40
Inlet temp in Circuit 1
36
Inlet temp in Circuit 2
Inlet temp in Circuit 3
32
Outlet temp in Circuit 1
Temperature of refrigerant ( o C) 20
28
Outlet temp in Circuit 2
Outlet temp in Circuit 3
24
16
12
4 8 175 s
168 s 181 s
0
0 20 40 60 80 100 120 140 160 180 200 220 240
Defrosting time (s)
Fig. 4.12 Refrigerant temperature in each circuit.