
Page 114 - Defrosting for Air Source Heat Pump
P. 114
106 Defrosting for Air Source Heat Pump
4.3.2.3 Case 3
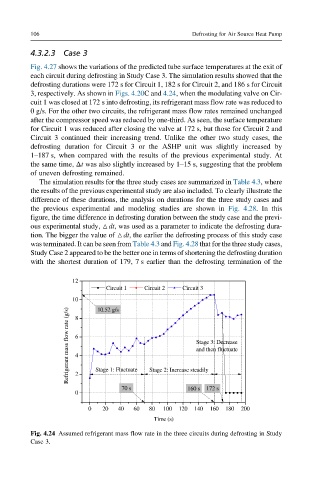
Fig. 4.27 shows the variations of the predicted tube surface temperatures at the exit of
each circuit during defrosting in Study Case 3. The simulation results showed that the
defrosting durations were 172 s for Circuit 1, 182 s for Circuit 2, and 186 s for Circuit
3, respectively. As shown in Figs. 4.20C and 4.24, when the modulating valve on Cir-
cuit 1 was closed at 172 s into defrosting, its refrigerant mass flow rate was reduced to
0 g/s. For the other two circuits, the refrigerant mass flow rates remained unchanged
after the compressor speed was reduced by one-third. As seen, the surface temperature
for Circuit 1 was reduced after closing the valve at 172 s, but those for Circuit 2 and
Circuit 3 continued their increasing trend. Unlike the other two study cases, the
defrosting duration for Circuit 3 or the ASHP unit was slightly increased by
1–187 s, when compared with the results of the previous experimental study. At
the same time, Δt was also slightly increased by 1–15 s, suggesting that the problem
of uneven defrosting remained.
The simulation results for the three study cases are summarized in Table 4.3,where
the results of the previous experimental study are also included. To clearly illustrate the
difference of these durations, the analysis on durations for the three study cases and
the previous experimental and modeling studies are shown in Fig. 4.28.In this
figure, the time difference in defrosting duration between the study case and the previ-
ous experimental study, △dt, was used as a parameter to indicate the defrosting dura-
tion. The bigger the value of △dt, the earlier the defrosting process of this study case
was terminated. It can be seen from Table 4.3 and Fig. 4.28 that for the three study cases,
Study Case 2 appeared to be the better one in terms of shortening the defrosting duration
with the shortest duration of 179, 7 s earlier than the defrosting termination of the
12
Circuit 1 Circuit 2 Circuit 3
10 8 10.52 g/s
Refrigerant mass flow rate (g/s) 6 4 Stage 3: Decrease
and then fluctuate
Stage 1: Fluctuate
2
160 s
70 s Stage 2: Increase steadily 172 s
0
0 20 40 60 80 100 120 140 160 180 200
Time (s)
Fig. 4.24 Assumed refrigerant mass flow rate in the three circuits during defrosting in Study
Case 3.