
Page 115 - Defrosting for Air Source Heat Pump
P. 115
Modeling study on uneven defrosting 107
28
Circuit 1 Circuit 2 Circuit 3
24
Tube surface temperature at exit ( o C) 16 8 T > T > T 3 T > T > T 3
20
1
2
1
2
12
183 s
0 4 95 s 178 s
80 100 120 140 160 180 200
Time (s)
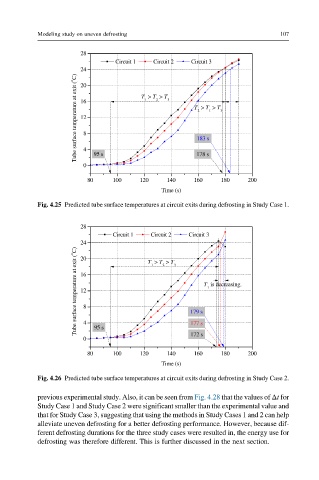
Fig. 4.25 Predicted tube surface temperatures at circuit exits during defrosting in Study Case 1.
28
Circuit 1 Circuit 2 Circuit 3
24 T > T > T 3
Tube surface temperature at exit ( o C) 16 8 179 s T is decreasing.
20
1
2
1
12
172 s
0 4 95 s 177 s
80 100 120 140 160 180 200
Time (s)
Fig. 4.26 Predicted tube surface temperatures at circuit exits during defrosting in Study Case 2.
previous experimental study. Also, it can be seen from Fig. 4.28 that the values of Δt for
Study Case 1 and Study Case 2 were significant smaller than the experimental value and
that for Study Case 3, suggesting that using the methods in Study Cases 1 and 2 can help
alleviate uneven defrosting for a better defrosting performance. However, because dif-
ferent defrosting durations for the three study cases were resulted in, the energy use for
defrosting was therefore different. This is further discussed in the next section.