
Page 112 - Defrosting for Air Source Heat Pump
P. 112
104 Defrosting for Air Source Heat Pump
4.3.2 Results and analysis
Using the validated empirical model introduced in the previous section, a modeling
study for the three study cases was undertaken and the study results are shown in
Figs. 4.25–4.27 for the three study cases. In addition, to illustrate the effectiveness
of varying heat supply to the respective refrigerant circuit, the results of the previous
experimental study for the setting of not using water-collecting trays between cir-
cuits shown in Fig. 4.21 were also used for comparison purposes. In Figs. 4.21
and 4.25–4.27, for their time (horizontal) axis, although defrosting starts at 0,
80 s is the chosen time point for these figures in order to more clearly show the tem-
perature rise during defrosting. Further, Table 4.3 summarizes the defrosting dura-
tions in the previous experimental study and the three study cases. For the results
presented here in the three study cases, the time difference in defrosting duration
between Circuit 1 and Circuit 3, Δt, was used as a parameter to indicate the degree
of uneven defrosting. The smaller the value of Δt , the uneven defrosting was elim-
inated much more effectively.
4.3.2.1 Case 1
Fig. 4.25 shows the variations of the predicted tube surface temperatures at the exit of
each circuit during defrosting in Study Case 1. It can be seen that the defrosting dura-
tions were 178 s for Circuit 1 and Circuit 2, and 183 s for Circuit 3, respectively. From
95 to 180 s into defrosting, the temperature order of the three circuits was kept at
T 1 > T 2 > T 3. However, the temperature order changed to T 2 > T 1 > T 3 after 180 s
into defrosting, because the refrigerant mass flow rate distributed into Circuit 1
was less than that in the others. This phenomenon met the changes in the proportion
of the refrigerant distribution into each circuit in Study Case 1, as shown in
Figs. 4.20A and 4.22. It also can be found that the defrosting durations for Circuit
2 and Circuit 3 were shortened, but that for Circuit 1 was slightly extended as com-
pared to the experimental results shown in Fig. 4.21. This was because the refrigerant
supply to each circuit was no longer the same. Following Assumption (ii) specified in
Section 2.4, as shown in Figs. 4.20A and 4.22, the refrigerant mass flow rate during
defrosting in Circuit 1 decreased to 95.6% of the previous value, and that in Circuits 2
and 3 increased to 101.1% and 103.3% of the previous values, respectively. Compared
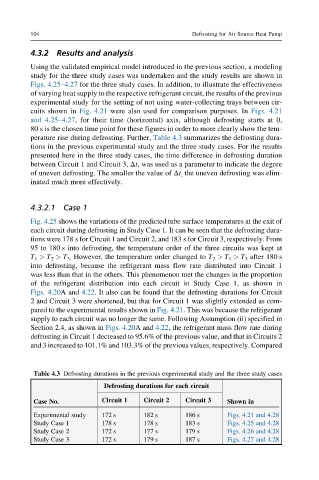
Table 4.3 Defrosting durations in the previous experimental study and the three study cases
Defrosting durations for each circuit
Case No. Circuit 1 Circuit 2 Circuit 3 Shown in
Experimental study 172 s 182 s 186 s Figs. 4.21 and 4.28
Study Case 1 178 s 178 s 183 s Figs. 4.25 and 4.28
Study Case 2 172 s 177 s 179 s Figs. 4.26 and 4.28
Study Case 3 172 s 179 s 187 s Figs. 4.27 and 4.28