
Page 113 - Defrosting for Air Source Heat Pump
P. 113
Modeling study on uneven defrosting 105
to the results from the previous experimental study, the defrosting duration for Circuit
3 or the ASHP unit was decreased by 3 s, or 1.6%. Also, as seen, Δt was 5 s, which is
much shorter than the experimental value of 14 s, suggesting that the uneven
defrosting was significantly alleviated.
4.3.2.2 Case 2
Fig. 4.26 shows the variations of the predicted tube surface temperatures at the exit of
each circuit during defrosting in Study Case 2. The simulation results demonstrated
that the defrosting for the durations was 173 s for Circuit 1, 176 s for Circuit 2,
and 179 s for Circuit 3, respectively. From 95 to 175 s into defrosting, the temperature
order of the three circuits was kept at T 1 > T 2 > T 3. When the tube surface tempera-
ture at the exit of Circuit 1 reached 24°C at 173 s into defrosting, its modulating valve
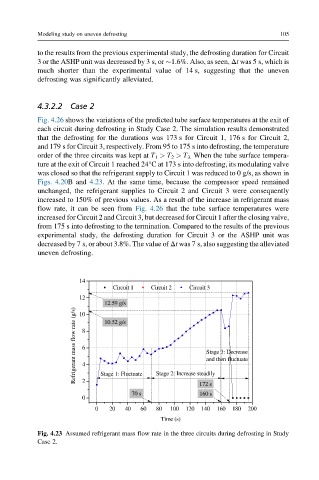
was closed so that the refrigerant supply to Circuit 1 was reduced to 0 g/s, as shown in
Figs. 4.20B and 4.23. At the same time, because the compressor speed remained
unchanged, the refrigerant supplies to Circuit 2 and Circuit 3 were consequently
increased to 150% of previous values. As a result of the increase in refrigerant mass
flow rate, it can be seen from Fig. 4.26 that the tube surface temperatures were
increased for Circuit 2 and Circuit 3, but decreased for Circuit 1 after the closing valve,
from 175 s into defrosting to the termination. Compared to the results of the previous
experimental study, the defrosting duration for Circuit 3 or the ASHP unit was
decreased by 7 s, or about 3.8%. The value of Δt was 7 s, also suggesting the alleviated
uneven defrosting.
14
Circuit 1 Circuit 2 Circuit 3
12
12.59 g/s
Refrigerant mass flow rate (g/s) 8 6 4 Stage 3: Decrease
10
10.52 g/s
and then fluctuate
Stage 1: Fluctuate
2
172 s
70 s Stage 2: Increase steadily
160 s
0
0 20 40 60 80 100 120 140 160 180 200
Time (s)
Fig. 4.23 Assumed refrigerant mass flow rate in the three circuits during defrosting in Study
Case 2.