
Page 110 - Defrosting for Air Source Heat Pump
P. 110
102 Defrosting for Air Source Heat Pump
28
Circuit 1 Circuit 2 Circuit 3
24
Tube surface temperature ( o C) 16 8 T > T > T 3
20
2
1
12
186 s
4
182 s
0 172 s
80 100 120 140 160 180 200
Time (s)
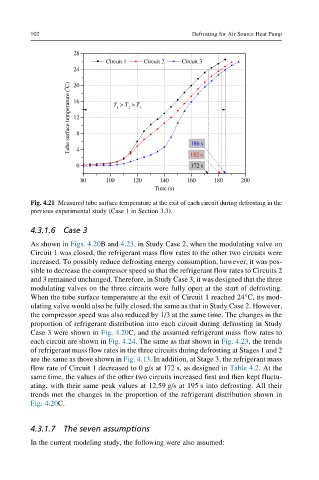
Fig. 4.21 Measured tube surface temperature at the exit of each circuit during defrosting in the
previous experimental study (Case 1 in Section 3.3).
4.3.1.6 Case 3
As shown in Figs. 4.20Band 4.23, in Study Case 2, when the modulating valve on
Circuit 1 was closed, the refrigerant mass flow rates to the other two circuits were
increased. To possibly reduce defrosting energy consumption, however, it was pos-
sible to decrease the compressor speed so that the refrigerant flow rates to Circuits 2
and 3 remained unchanged. Therefore, in Study Case 3, it was designed that the three
modulating valves on the three circuits were fully open at the start of defrosting.
When the tube surface temperature at the exit of Circuit 1 reached 24°C, its mod-
ulating valve would also be fully closed, the same as that in Study Case 2. However,
the compressor speed was also reduced by 1/3 at the same time. The changes in the
proportion of refrigerant distribution into each circuit during defrosting in Study
Case 3wereshownin Fig. 4.20C, and the assumed refrigerant mass flow rates to
each circuit are shown in Fig. 4.24. The same as that shown in Fig. 4.23, the trends
of refrigerant mass flow rates in the three circuits during defrosting at Stages 1 and 2
are the same as those shown in Fig. 4.13. In addition, at Stage 3, the refrigerant mass
flow rate of Circuit 1 decreased to 0 g/s at 172 s, as designed in Table 4.2.Atthe
same time, the values of the other two circuits increased first and then kept fluctu-
ating, with their same peak values at 12.59 g/s at 195 s into defrosting. All their
trends met the changes in the proportion of the refrigerant distribution shown in
Fig. 4.20C.
4.3.1.7 The seven assumptions
In the current modeling study, the following were also assumed: