
Page 223 - Defrosting for Air Source Heat Pump
P. 223
The influence of refrigerant distribution on defrosting 217
retained water on the surface of the outdoor coil, and heat the cold ambient air. Also,
only the energy consumed in frost melting and water vaporing are big enough and
calculated, with the sensible heat of the melted frost and surrounding air taken away
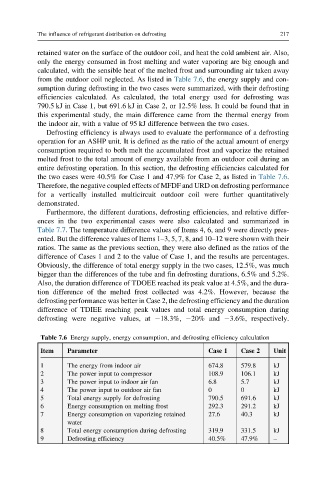
from the outdoor coil neglected. As listed in Table 7.6, the energy supply and con-
sumption during defrosting in the two cases were summarized, with their defrosting
efficiencies calculated. As calculated, the total energy used for defrosting was
790.5 kJ in Case 1, but 691.6 kJ in Case 2, or 12.5% less. It could be found that in
this experimental study, the main difference came from the thermal energy from
the indoor air, with a value of 95 kJ difference between the two cases.
Defrosting efficiency is always used to evaluate the performance of a defrosting
operation for an ASHP unit. It is defined as the ratio of the actual amount of energy
consumption required to both melt the accumulated frost and vaporize the retained
melted frost to the total amount of energy available from an outdoor coil during an
entire defrosting operation. In this section, the defrosting efficiencies calculated for
the two cases were 40.5% for Case 1 and 47.9% for Case 2, as listed in Table 7.6.
Therefore, the negative coupled effects of MFDF and URD on defrosting performance
for a vertically installed multicircuit outdoor coil were further quantitatively
demonstrated.
Furthermore, the different durations, defrosting efficiencies, and relative differ-
ences in the two experimental cases were also calculated and summarized in
Table 7.7. The temperature difference values of Items 4, 6, and 9 were directly pres-
ented. But the difference values of Items 1–3, 5, 7, 8, and 10–12 were shown with their
ratios. The same as the previous section, they were also defined as the ratios of the
difference of Cases 1 and 2 to the value of Case 1, and the results are percentages.
Obviously, the difference of total energy supply in the two cases, 12.5%, was much
bigger than the differences of the tube and fin defrosting durations, 6.5% and 5.2%.
Also, the duration difference of TDOEE reached its peak value at 4.5%, and the dura-
tion difference of the melted frost collected was 4.2%. However, because the
defrosting performance was better in Case 2, the defrosting efficiency and the duration
difference of TDIEE reaching peak values and total energy consumption during
defrosting were negative values, at 18.3%, 20% and 3.6%, respectively.
Table 7.6 Energy supply, energy consumption, and defrosting efficiency calculation
Item Parameter Case 1 Case 2 Unit
1 The energy from indoor air 674.8 579.8 kJ
2 The power input to compressor 108.9 106.1 kJ
3 The power input to indoor air fan 6.8 5.7 kJ
4 The power input to outdoor air fan 0 0 kJ
5 Total energy supply for defrosting 790.5 691.6 kJ
6 Energy consumption on melting frost 292.3 291.2 kJ
7 Energy consumption on vaporizing retained 27.6 40.3 kJ
water
8 Total energy consumption during defrosting 319.9 331.5 kJ
9 Defrosting efficiency 40.5% 47.9% –