
Page 218 - Defrosting for Air Source Heat Pump
P. 218
212 Defrosting for Air Source Heat Pump
order changing at the period of 129–168 s. It is obvious that there was suddenly a
decrease in Circuit 2, which resulted from the melted frost flowing onto the
thermocouple.
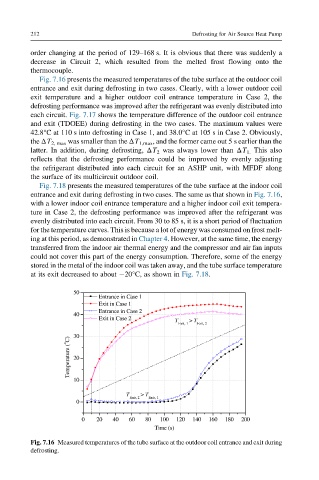
Fig. 7.16 presents the measured temperatures of the tube surface at the outdoor coil
entrance and exit during defrosting in two cases. Clearly, with a lower outdoor coil
exit temperature and a higher outdoor coil entrance temperature in Case 2, the
defrosting performance was improved after the refrigerant was evenly distributed into
each circuit. Fig. 7.17 shows the temperature difference of the outdoor coil entrance
and exit (TDOEE) during defrosting in the two cases. The maximum values were
42.8°C at 110 s into defrosting in Case 1, and 38.0°C at 105 s in Case 2. Obviously,
the ΔT 2, max was smaller than the ΔT 1,max , and the former came out 5 s earlier than the
latter. In addition, during defrosting, ΔT 2 was always lower than ΔT 1. This also
reflects that the defrosting performance could be improved by evenly adjusting
the refrigerant distributed into each circuit for an ASHP unit, with MFDF along
the surface of its multicircuit outdoor coil.
Fig. 7.18 presents the measured temperatures of the tube surface at the indoor coil
entrance and exit during defrosting in two cases. The same as that shown in Fig. 7.16,
with a lower indoor coil entrance temperature and a higher indoor coil exit tempera-
ture in Case 2, the defrosting performance was improved after the refrigerant was
evenly distributed into each circuit. From 30 to 85 s, it is a short period of fluctuation
for the temperature curves. This is because a lot of energy was consumed on frost melt-
ing at this period, as demonstrated in Chapter 4. However, at the same time, the energy
transferred from the indoor air thermal energy and the compressor and air fan inputs
could not cover this part of the energy consumption. Therefore, some of the energy
stored in the metal of the indoor coil was taken away, and the tube surface temperature
at its exit decreased to about 20°C, as shown in Fig. 7.18.
50
Entrance in Case 1
Exit in Case 1
Entrance in Case 2
40
Exit in Case 2
T > T
Exit, 1 Exit, 2
30
Temperature ( o C) 20
10
T > T
Entr, 2 Entr, 1
0
0 20 40 60 80 100 120 140 160 180 200
Time (s)
Fig. 7.16 Measured temperatures of the tube surface at the outdoor coil entrance and exit during
defrosting.