Page 215 - Defrosting for Air Source Heat Pump
P. 215

The influence of refrigerant distribution on defrosting           209

           from Figs. 7.11A and B, the surface conditions at the start of defrosting for each circuit
           in the two cases were virtually the same, which agreed well with the data listed in
           Table 7.5. Therefore, a similar mass of frost accumulation, frost accumulated at
           the same FECs, both higher than 90%. Obviously, different RDEVs make this com-
           parative study meaningful.
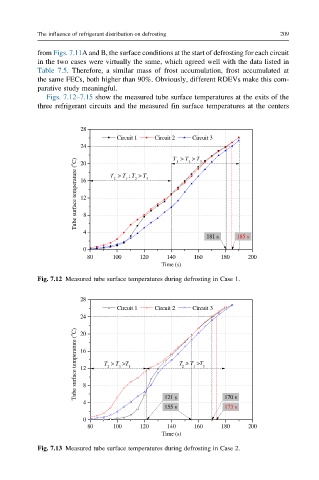
              Figs. 7.12–7.15 show the measured tube surface temperatures at the exits of the
           three refrigerant circuits and the measured fin surface temperatures at the centers


                       28
                                 Circuit 1     Circuit 2     Circuit 3
                       24                       T  > T  > T 3

                      Tube surface temperature ( o C)  16  T  > T ; T  > T 3
                                                    2
                                                 1
                       20
                                   1
                                      2
                                2
                       12


                        4 8
                                                         181 s   185 s
                        0
                         80    100     120    140    160     180    200
                                             Time (s)

           Fig. 7.12 Measured tube surface temperatures during defrosting in Case 1.

                       28
                                 Circuit 1     Circuit 2     Circuit 3
                       24
                      Tube surface temperature ( o C)  16  T  > T  >T 1  T 2  1  >T 3
                       20


                                 3
                              2
                       12


                       4 8                   121 s            170 s
                                             155 s            173 s
                       0
                         80     100    120    140    160     180    200
                                             Time (s)
           Fig. 7.13 Measured tube surface temperatures during defrosting in Case 2.
   210   211   212   213   214   215   216   217   218   219   220