
Page 216 - Defrosting for Air Source Heat Pump
P. 216
210 Defrosting for Air Source Heat Pump
28
Fin in Circuit 1
Fin in Circuit 2
24
Fin in Circuit 3
Fin surface temperature ( o C) 16 T > T ; T > T 3 T > T ; T > T 2
20
12
3
1
1
2
3
2
205 s
4 8 211 s
127 s
203 s
0
80 100 120 140 160 180 200 220
Time (s)
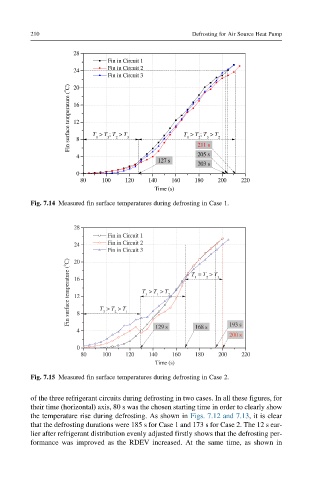
Fig. 7.14 Measured fin surface temperatures during defrosting in Case 1.
28
Fin in Circuit 1
24 Fin in Circuit 2
Fin in Circuit 3
Fin surface temperature ( o C) 16 T > T > T T > T > T 2 T = T > T 3
20
1
2
3
1
12
4 8 3 2 1 129 s 168 s 193 s
200 s
0
80 100 120 140 160 180 200 220
Time (s)
Fig. 7.15 Measured fin surface temperatures during defrosting in Case 2.
of the three refrigerant circuits during defrosting in two cases. In all these figures, for
their time (horizontal) axis, 80 s was the chosen starting time in order to clearly show
the temperature rise during defrosting. As shown in Figs. 7.12 and 7.13, it is clear
that the defrosting durations were 185 s for Case 1 and 173 s for Case 2. The 12 s ear-
lier after refrigerant distribution evenly adjusted firstly shows that the defrosting per-
formance was improved as the RDEV increased. At the same time, as shown in