
Page 219 - Defrosting for Air Source Heat Pump
P. 219
The influence of refrigerant distribution on defrosting 213
50
Case 1
o
45 Case 2 ΔT 1, max = 42.8 C
40 ΔT 1 > ΔT 2
Temperature difference ( o C) 30 ΔT 2, max = 38.0 C
35
o
25
20
15
10 105 s
110 s
5
0 20 40 60 80 100 120 140 160 180 200
Time (s)
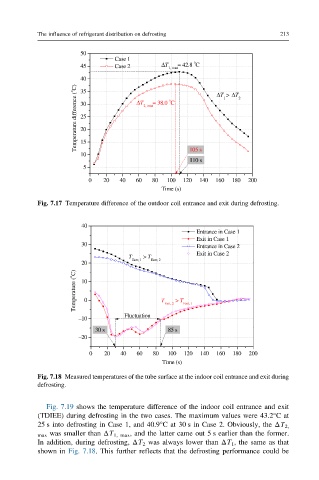
Fig. 7.17 Temperature difference of the outdoor coil entrance and exit during defrosting.
40
Entrance in Case 1
Exit in Case 1
30 Entrance in Case 2
Exit in Case 2
T > T
Entr, 1 Entr, 2
20
Temperature ( o C) 10 0 T > T
Fluctuation Exit, 2 Exit, 1
–10
30 s 85 s
–20
0 20 40 60 80 100 120 140 160 180 200
Time (s)
Fig. 7.18 Measured temperatures of the tube surface at the indoor coil entrance and exit during
defrosting.
Fig. 7.19 shows the temperature difference of the indoor coil entrance and exit
(TDIEE) during defrosting in the two cases. The maximum values were 43.2°Cat
25 s into defrosting in Case 1, and 40.9°C at 30 s in Case 2. Obviously, the ΔT 2,
max was smaller than ΔT 1, max , and the latter came out 5 s earlier than the former.
In addition, during defrosting, ΔT 2 was always lower than ΔT 1 , the same as that
shown in Fig. 7.18. This further reflects that the defrosting performance could be