
Page 221 - Defrosting for Air Source Heat Pump
P. 221
The influence of refrigerant distribution on defrosting 215
melting stage consumed a lot of energy, with a lot of refrigerant changing phases from
gas to liquid or a two-phase state. This might be the reason why the measured refrig-
erant mass flow rate kept fluctuating severely from 0 to 74 s, especially during the first
50 s into defrosting. When the defrosting process came into the water layer vaporizing
stage described in Chapter 4, the compressor suction and discharge pressures
increased, with the refrigerant volumetric flow rate changing from increasing to
decreasing. As shown in Fig. 7.20, their peak values nearly both came out at 160 s
into defrosting in the two cases. From 74 to 152 s, the refrigerant volumetric flow rate
order of the two cases was at R 2 > R 1 . The peak value in Case 2 was slightly lower
than that in Case 1. It is demonstrated that the defrosting operation in Case 2 was
terminated a little quicker. For an ASHP unit with a vertically installed multicircuit
outdoor coil, this is more proof to demonstrate the negative coupled effects of MFDF
and URD on defrosting performance.
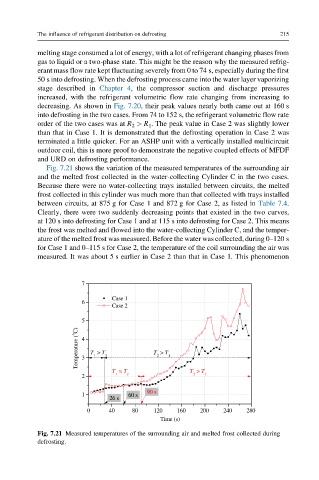
Fig. 7.21 shows the variation of the measured temperatures of the surrounding air
and the melted frost collected in the water-collecting Cylinder C in the two cases.
Because there were no water-collecting trays installed between circuits, the melted
frost collected in this cylinder was much more than that collected with trays installed
between circuits, at 875 g for Case 1 and 872 g for Case 2, as listed in Table 7.4.
Clearly, there were two suddenly decreasing points that existed in the two curves,
at 120 s into defrosting for Case 1 and at 115 s into defrosting for Case 2. This means
the frost was melted and flowed into the water-collecting Cylinder C, and the temper-
ature of the melted frost was measured. Before the water was collected, during 0–120 s
for Case 1 and 0–115 s for Case 2, the temperature of the coil surrounding the air was
measured. It was about 5 s earlier in Case 2 than that in Case 1. This phenomenon
7
Case 1
6
Case 2
5
Temperature ( o C) 4 3 T > T 2 T > T 1
2
1
T T T > T
2 1 2 2 1
1 60 s 90 s
26 s
0 40 80 120 160 200 240 280
Time (s)
Fig. 7.21 Measured temperatures of the surrounding air and melted frost collected during
defrosting.