Page 220 - Defrosting for Air Source Heat Pump
P. 220

214                                         Defrosting for Air Source Heat Pump


                     45
                                          o
                                  T   = 43.2  C               Case 1
                     40            1, max    o
                                    T   =  40.9  C            Case 2
                                     2, max
                     35
                   Temperature difference ( o C)  25  T  >  T 2
                     30
                     20
                                                     1
                     15
                     10
                      5
                                 25 s
                      0
                                 30 s
                     –5
                       0    25    50   75   100   125  150   175  200
                                           Time (s)
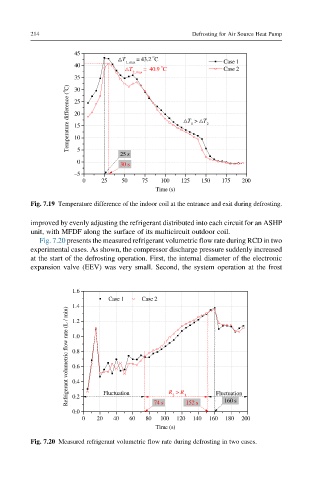
         Fig. 7.19 Temperature difference of the indoor coil at the entrance and exit during defrosting.

         improved by evenly adjusting the refrigerant distributed into each circuit for an ASHP
         unit, with MFDF along the surface of its multicircuit outdoor coil.
            Fig. 7.20 presents the measured refrigerant volumetric flow rate during RCD in two
         experimental cases. As shown, the compressor discharge pressure suddenly increased
         at the start of the defrosting operation. First, the internal diameter of the electronic
         expansion valve (EEV) was very small. Second, the system operation at the frost


                     1.6
                               Case 1     Case 2
                     1.4
                   Refrigerant volumetric flow rate (L / min)  1.0
                     1.2


                     0.8
                     0.6

                     0.4
                     0.2
                                                2
                                                              160 s
                     0.0     Fluctuation   74 s  R  > R 1 152 s  Fluctuation
                       0   20   40  60  80  100  120  140  160  180  200
                                           Time (s)
         Fig. 7.20 Measured refrigerant volumetric flow rate during defrosting in two cases.
   215   216   217   218   219   220   221   222   223   224   225