
Page 250 - Defrosting for Air Source Heat Pump
P. 250
Energy transfer during defrosting 245
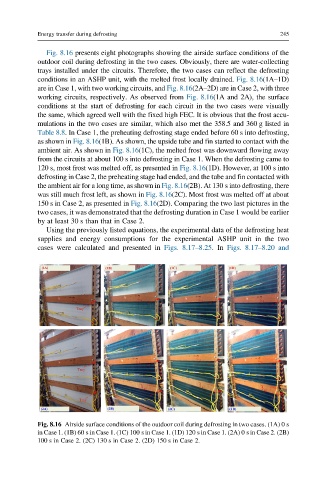
Fig. 8.16 presents eight photographs showing the airside surface conditions of the
outdoor coil during defrosting in the two cases. Obviously, there are water-collecting
trays installed under the circuits. Therefore, the two cases can reflect the defrosting
conditions in an ASHP unit, with the melted frost locally drained. Fig. 8.16(1A–1D)
are in Case 1, with two working circuits, and Fig. 8.16(2A–2D) are in Case 2, with three
working circuits, respectively. As observed from Fig. 8.16(1A and 2A), the surface
conditions at the start of defrosting for each circuit in the two cases were visually
the same, which agreed well with the fixed high FEC. It is obvious that the frost accu-
mulations in the two cases are similar, which also met the 358.5 and 360 g listed in
Table 8.8. In Case 1, the preheating defrosting stage ended before 60 s into defrosting,
as shown in Fig. 8.16(1B). As shown, the upside tube and fin started to contact with the
ambient air. As shown in Fig. 8.16(1C), the melted frost was downward flowing away
from the circuits at about 100 s into defrosting in Case 1. When the defrosting came to
120 s, most frost was melted off, as presented in Fig. 8.16(1D). However, at 100 s into
defrosting in Case 2, the preheating stage had ended, and the tube and fin contacted with
the ambient air for a long time, as shown in Fig. 8.16(2B). At 130 s into defrosting, there
was still much frost left, as shown in Fig. 8.16(2C). Most frost was melted off at about
150 s in Case 2, as presented in Fig. 8.16(2D). Comparing the two last pictures in the
two cases, it was demonstrated that the defrosting duration in Case 1 would be earlier
by at least 30 s than that in Case 2.
Using the previously listed equations, the experimental data of the defrosting heat
supplies and energy consumptions for the experimental ASHP unit in the two
cases were calculated and presented in Figs. 8.17–8.25.In Figs. 8.17–8.20 and
Fig. 8.16 Airside surface conditions of the outdoor coil during defrosting in two cases. (1A) 0 s
in Case 1. (1B) 60 s in Case 1. (1C) 100 s in Case 1. (1D) 120 s in Case 1. (2A) 0 s in Case 2. (2B)
100 s in Case 2. (2C) 130 s in Case 2. (2D) 150 s in Case 2.