
Page 254 - Defrosting for Air Source Heat Pump
P. 254
Energy transfer during defrosting 249
0.4
Tray A in Case 1
Tray B in Case 1
0.3 Tray A in Case 2
Tray B in Case 2 Case 1
Tray C in Case 2
0.2
Case 2
Temperature ( o C) 0.1
0.0
–0.1
–0.2
100 110 120 130 140 150 160 170 180
Time (s)
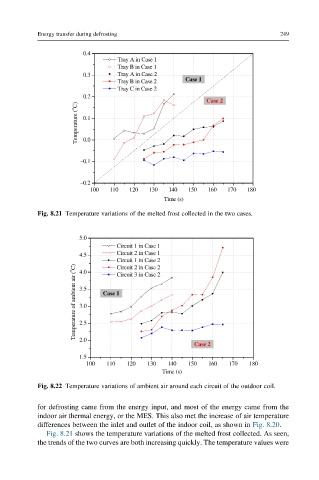
Fig. 8.21 Temperature variations of the melted frost collected in the two cases.
5.0
Circuit 1 in Case 1
4.5 Circuit 2 in Case 1
Circuit 1 in Case 2
Temperature of ambient air ( o C) 3.5 Case 1
Circuit 2 in Case 2
4.0
Circuit 3 in Case 2
3.0
2.5
2.0
Case 2
1.5
100 110 120 130 140 150 160 170 180
Time (s)
Fig. 8.22 Temperature variations of ambient air around each circuit of the outdoor coil.
for defrosting came from the energy input, and most of the energy came from the
indoor air thermal energy, or the MES. This also met the increase of air temperature
differences between the inlet and outlet of the indoor coil, as shown in Fig. 8.20.
Fig. 8.21 shows the temperature variations of the melted frost collected. As seen,
the trends of the two curves are both increasing quickly. The temperature values were