
Page 256 - Defrosting for Air Source Heat Pump
P. 256
Energy transfer during defrosting 251
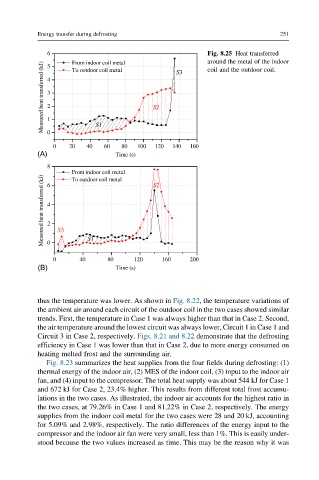
6 5 From indoor coil metal S3 Fig. 8.25 Heat transferred
around the metal of the indoor
Measured heat transferred (kJ) 4 3 2 1 S2
To outdoor coil metal
coil and the outdoor coil.
0
0 20 40 S1 60 80 100 120 140 160
(A) Time (s)
8
From indoor coil metal S2
Measured heat transferred (kJ) 4 2 S3
To outdoor coil metal
6
0
0 40 S1 80 120 160 200
(B) Time (s)
thus the temperature was lower. As shown in Fig. 8.22, the temperature variations of
the ambient air around each circuit of the outdoor coil in the two cases showed similar
trends. First, the temperature in Case 1 was always higher than that in Case 2. Second,
the air temperature around the lowest circuit was always lower, Circuit 1 in Case 1 and
Circuit 3 in Case 2, respectively. Figs. 8.21 and 8.22 demonstrate that the defrosting
efficiency in Case 1 was lower than that in Case 2, due to more energy consumed on
heating melted frost and the surrounding air.
Fig. 8.23 summarizes the heat supplies from the four fields during defrosting: (1)
thermal energy of the indoor air, (2) MES of the indoor coil, (3) input to the indoor air
fan, and (4) input to the compressor. The total heat supply was about 544 kJ for Case 1
and 672 kJ for Case 2, 23.4% higher. This results from different total frost accumu-
lations in the two cases. As illustrated, the indoor air accounts for the highest ratio in
the two cases, at 79.26% in Case 1 and 81.22% in Case 2, respectively. The energy
supplies from the indoor coil metal for the two cases were 28 and 20 kJ, accounting
for 5.09% and 2.98%, respectively. The ratio differences of the energy input to the
compressor and the indoor air fan were very small, less than 1%. This is easily under-
stood because the two values increased as time. This may be the reason why it was