
Page 252 - Defrosting for Air Source Heat Pump
P. 252
Energy transfer during defrosting 247
Fig.8.16(2B)
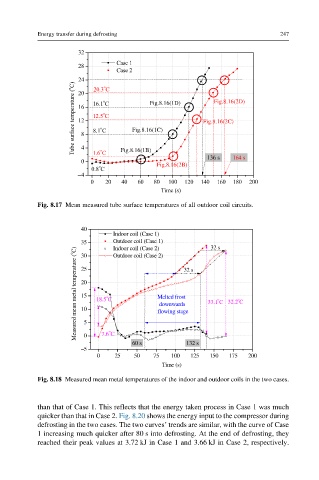
Fig. 8.17 Mean measured tube surface temperatures of all outdoor coil circuits.
40
Indoor coil (Case 1)
35 Outdoor coil (Case 1) 32 s
Indoor coil (Case 2)
Measured mean metal temperature ( o C) 25 18.5 C flowing stage 33.1 C 32.2 C
30
Outdoor coil (Case 2)
32 s
20
15
Melted frost
downwards
10
5
7.6 C
0
60 s 132 s
–5
0 25 50 75 100 125 150 175 200
Time (s)
Fig. 8.18 Measured mean metal temperatures of the indoor and outdoor coils in the two cases.
than that of Case 1. This reflects that the energy taken process in Case 1 was much
quicker than that in Case 2. Fig. 8.20 shows the energy input to the compressor during
defrosting in the two cases. The two curves’ trends are similar, with the curve of Case
1 increasing much quicker after 80 s into defrosting. At the end of defrosting, they
reached their peak values at 3.72 kJ in Case 1 and 3.66 kJ in Case 2, respectively.