Page 635 - Design for Six Sigma a Roadmap for Product Development
P. 635

588   Chapter Sixteen


                                                            2
           variance of the high-level requirement y, Var(y)    , follows the fol-
           lowing relationships:


                                            ∂f
                                ∂f
                                                            ∂f
                           2
                                                                  2
                                                  2
                 Var(y)             2    1      2    2    ...       2    i    ...
                                      2
                                ∂x i       ∂x 2            ∂x i

                                       ∂f
                                 ...       2    n 2
                                      ∂x n
           For a nonlinear relationship y   f(x 1 ,x 2 ,…,x i ,…,x n ) and
                                     2
                                                     2
                                                       2
                                   2
                                            2
                               2
                                                                2
                                          2
                     Var(y)      a 1   1   a 2   2    ...    a i   i    ...    a n   n 2
           For a linear transfer function y   a 1 x 1   a 2 x 2    ...    a i x i    ...    a n x n .
                                                                         2
                                            2
           Clearly, the reduction of Var(y)    can be achieved by reducing   i for
                ...
                                             2
           i   1 n. However, the reduction of   i values will incur cost. This vari-
           ance reduction cost might be different for different low-level character-
                                                                           2
           istics, that is, x i . However, the impact of reduction for each variance   i ,
           made on the reduction of Var(y),   , depends on the magnitude of sen-
                                           2
           sitivities |∂f/∂x i |. The greater the sensitivity, the greater the impact of
                            2
                                                 2
           the reduction of   i on the reduction of   . Therefore, it is more desir-
           able to tighten the tolerances for those parameters that have high sen-
           sitivity and low tolerance tightening costs. The objective of a cost-based
           optimal tolerance design is to find an optimum strategy that results in
           a minimum total cost (variability reduction cost   quality loss).
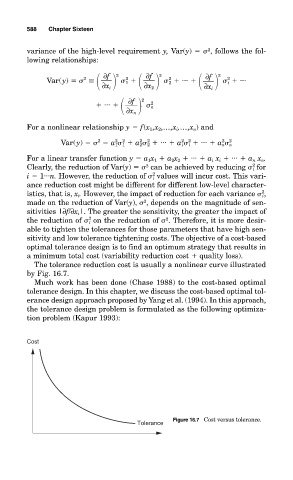
             The tolerance reduction cost is usually a nonlinear curve illustrated
           by Fig. 16.7.
             Much work has been done (Chase 1988) to the cost-based optimal
           tolerance design. In this chapter, we discuss the cost-based optimal tol-
           erance design approach proposed by Yang et al. (1994). In this approach,
           the tolerance design problem is formulated as the following optimiza-
           tion problem (Kapur 1993):
           Cost


                                                   Figure 16.7 Cost versus tolerance.
                                         Tolerance
   630   631   632   633   634   635   636   637   638   639   640