
Page 630 - Design for Six Sigma a Roadmap for Product Development
P. 630
Tolerance Design 583
y = x + x + … + x + … + x
x i 1 2 i 10
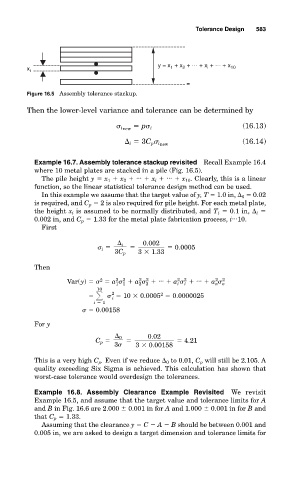
Figure 16.5 Assembly tolerance stackup.
Then the lower-level variance and tolerance can be determined by
(16.13)
i new p i
(16.14)
i 3C p i new
Example 16.7. Assembly tolerance stackup revisited Recall Example 16.4
where 10 metal plates are stacked in a pile (Fig. 16.5).
The pile height y x 1 x 2 ... x i ... x 10 . Clearly, this is a linear
function, so the linear statistical tolerance design method can be used.
In this example we assume that the target value of y, T 1.0 in, 0 0.02
is required, and C p 2 is also required for pile height. For each metal plate,
the height x i is assumed to be normally distributed, and T i 0.1 in, i
...
0.002 in, and C p 1.33 for the metal plate fabrication process, i 10.
First
0.002
i
i 0.0005
3C p 3
1.33
Then
2
2
2
2
2 2
2
2
Var(y) a 1 1 a 2 2 ... a i i ... a n n 2
10
2
2
10
0.0005 0.0000025
i
i 1
0.00158
For y
0 0.02
C p 4.21
3 3
0.00158
This is a very high C p . Even if we reduce 0 to 0.01, C p will still be 2.105. A
quality exceeding Six Sigma is achieved. This calculation has shown that
worst-case tolerance would overdesign the tolerances.
Example 16.8. Assembly Clearance Example Revisited We revisit
Example 16.5, and assume that the target value and tolerance limits for A
and B in Fig. 16.6 are 2.000 0.001 in for A and 1.000 0.001 in for B and
that C p 1.33.
Assuming that the clearance y C A B should be between 0.001 and
0.005 in, we are asked to design a target dimension and tolerance limits for