
Page 278 - Distributed model predictive control for plant-wide systems
P. 278
252 Distributed Model Predictive Control for Plant-Wide Systems
650
Measurement of CT
640 Prediction of CT
Temperature (°C) 620
630
610
600
590
580
0 2 4 6 8 10 12 14 16 18
Time (s)
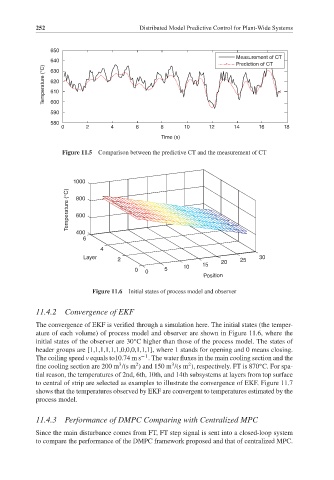
Figure 11.5 Comparison between the predictive CT and the measurement of CT
1000
Temperature (°C) 800
600
400
6
4
Layer 2 25 30
15 20
10
0 0 5
Position
Figure 11.6 Initial states of process model and observer
11.4.2 Convergence of EKF
The convergence of EKF is verified through a simulation here. The initial states (the temper-
ature of each volume) of process model and observer are shown in Figure 11.6, where the
◦
initial states of the observer are 30 C higher than those of the process model. The states of
header groups are [1,1,1,1,1,1,0,0,0,1,1,1], where 1 stands for opening and 0 means closing.
The coiling speed v equals to10.74 m s − 1 . The water fluxes in the main cooling section and the
◦
2
3
3
2
fine cooling section are 200 m /(s m ) and 150 m /(s m ), respectively. FT is 870 C. For spa-
tial reason, the temperatures of 2nd, 6th, 10th, and 14th subsystems at layers from top surface
to central of strip are selected as examples to illustrate the convergence of EKF. Figure 11.7
shows that the temperatures observed by EKF are convergent to temperatures estimated by the
process model.
11.4.3 Performance of DMPC Comparing with Centralized MPC
Since the main disturbance comes from FT, FT step signal is sent into a closed-loop system
to compare the performance of the DMPC framework proposed and that of centralized MPC.