
Page 563 - Dynamics of Mechanical Systems
P. 563
0593_C16_fm Page 544 Tuesday, May 7, 2002 7:06 AM
544 Dynamics of Mechanical Systems
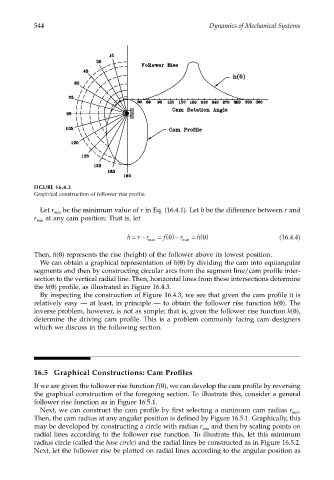
FIGURE 16.4.3
Graphical construction of follower rise profile.
Let r min be the minimum value of r in Eq. (16.4.1). Let h be the difference between r and
r min at any cam position: That is, let
θ
h =− min = f() − r min = h() θ (16.4.4)
r r
Then, h(θ) represents the rise (height) of the follower above its lowest position.
We can obtain a graphical representation of h(θ) by dividing the cam into equiangular
segments and then by constructing circular arcs from the segment line/cam profile inter-
section to the vertical radial line. Then, horizontal lines from these intersections determine
the h(θ) profile, as illustrated in Figure 16.4.3.
By inspecting the construction of Figure 16.4.3, we see that given the cam profile it is
relatively easy — at least, in principle — to obtain the follower rise function h(θ). The
inverse problem, however, is not as simple; that is, given the follower rise function h(θ),
determine the driving cam profile. This is a problem commonly facing cam designers
which we discuss in the following section.
16.5 Graphical Constructions: Cam Profiles
If we are given the follower rise function f(θ), we can develop the cam profile by reversing
the graphical construction of the foregoing section. To illustrate this, consider a general
follower rise function as in Figure 16.5.1.
Next, we can construct the cam profile by first selecting a minimum cam radius r min .
Then, the cam radius at any angular position is defined by Figure 16.5.1. Graphically, this
may be developed by constructing a circle with radius r min and then by scaling points on
radial lines according to the follower rise function. To illustrate this, let this minimum
radius circle (called the base circle) and the radial lines be constructed as in Figure 16.5.2.
Next, let the follower rise be plotted on radial lines according to the angular position as