
Page 56 - Earth's Climate Past and Future
P. 56
32 PART I • Framework of Climate Science
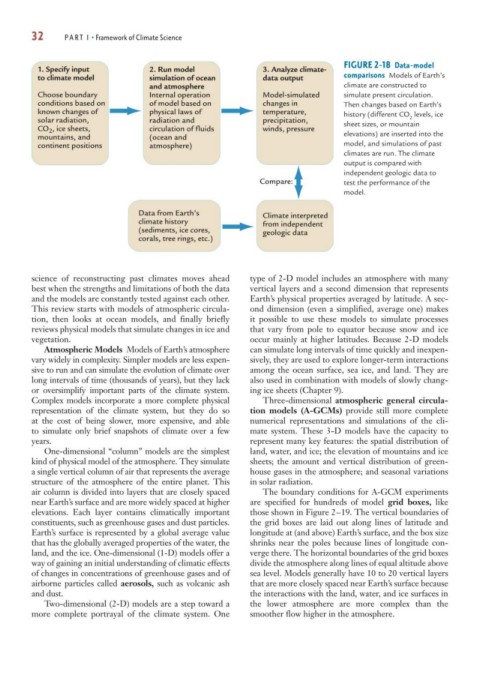
FIGURE 2-18 Data-model
1. Specify input 2. Run model 3. Analyze climate-
to climate model simulation of ocean data output comparisons Models of Earth’s
and atmosphere climate are constructed to
Choose boundary Internal operation Model-simulated simulate present circulation.
conditions based on of model based on changes in Then changes based on Earth’s
known changes of physical laws of temperature, history (different CO levels, ice
2
solar radiation, radiation and precipitation, sheet sizes, or mountain
CO , ice sheets, circulation of fluids winds, pressure
2
mountains, and (ocean and elevations) are inserted into the
continent positions atmosphere) model, and simulations of past
climates are run. The climate
output is compared with
independent geologic data to
Compare: test the performance of the
model.
Data from Earth’s Climate interpreted
climate history from independent
(sediments, ice cores, geologic data
corals, tree rings, etc.)
science of reconstructing past climates moves ahead type of 2-D model includes an atmosphere with many
best when the strengths and limitations of both the data vertical layers and a second dimension that represents
and the models are constantly tested against each other. Earth’s physical properties averaged by latitude. A sec-
This review starts with models of atmospheric circula- ond dimension (even a simplified, average one) makes
tion, then looks at ocean models, and finally briefly it possible to use these models to simulate processes
reviews physical models that simulate changes in ice and that vary from pole to equator because snow and ice
vegetation. occur mainly at higher latitudes. Because 2-D models
Atmospheric Models Models of Earth’s atmosphere can simulate long intervals of time quickly and inexpen-
vary widely in complexity. Simpler models are less expen- sively, they are used to explore longer-term interactions
sive to run and can simulate the evolution of climate over among the ocean surface, sea ice, and land. They are
long intervals of time (thousands of years), but they lack also used in combination with models of slowly chang-
or oversimplify important parts of the climate system. ing ice sheets (Chapter 9).
Complex models incorporate a more complete physical Three-dimensional atmospheric general circula-
representation of the climate system, but they do so tion models (A-GCMs) provide still more complete
at the cost of being slower, more expensive, and able numerical representations and simulations of the cli-
to simulate only brief snapshots of climate over a few mate system. These 3-D models have the capacity to
years. represent many key features: the spatial distribution of
One-dimensional “column” models are the simplest land, water, and ice; the elevation of mountains and ice
kind of physical model of the atmosphere. They simulate sheets; the amount and vertical distribution of green-
a single vertical column of air that represents the average house gases in the atmosphere; and seasonal variations
structure of the atmosphere of the entire planet. This in solar radiation.
air column is divided into layers that are closely spaced The boundary conditions for A-GCM experiments
near Earth’s surface and are more widely spaced at higher are specified for hundreds of model grid boxes, like
elevations. Each layer contains climatically important those shown in Figure 2–19. The vertical boundaries of
constituents, such as greenhouse gases and dust particles. the grid boxes are laid out along lines of latitude and
Earth’s surface is represented by a global average value longitude at (and above) Earth’s surface, and the box size
that has the globally averaged properties of the water, the shrinks near the poles because lines of longitude con-
land, and the ice. One-dimensional (1-D) models offer a verge there. The horizontal boundaries of the grid boxes
way of gaining an initial understanding of climatic effects divide the atmosphere along lines of equal altitude above
of changes in concentrations of greenhouse gases and of sea level. Models generally have 10 to 20 vertical layers
airborne particles called aerosols, such as volcanic ash that are more closely spaced near Earth’s surface because
and dust. the interactions with the land, water, and ice surfaces in
Two-dimensional (2-D) models are a step toward a the lower atmosphere are more complex than the
more complete portrayal of the climate system. One smoother flow higher in the atmosphere.