
Page 57 - Earth's Climate Past and Future
P. 57
CHAPTER 2 • Climate Archives, Data, and Models 33
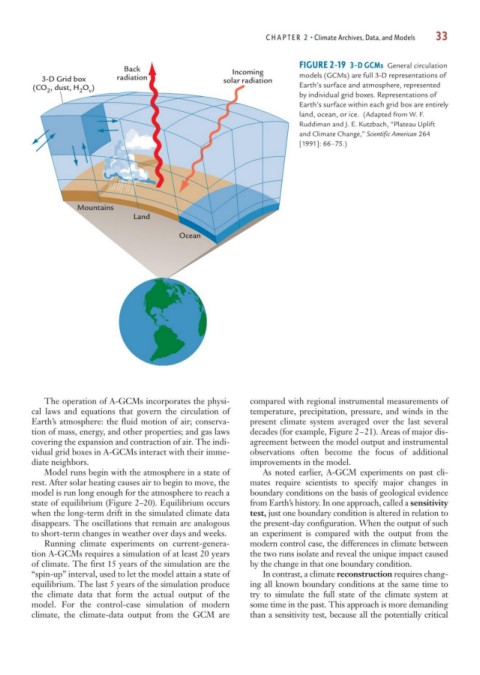
FIGURE 2-19 3-D GCMs General circulation
Back Incoming
3-D Grid box radiation solar radiation models (GCMs) are full 3-D representations of
(CO , dust, H O ) Earth’s surface and atmosphere, represented
2 2 v
by individual grid boxes. Representations of
Earth’s surface within each grid box are entirely
land, ocean, or ice. (Adapted from W. F.
Ruddiman and J. E. Kutzbach, “Plateau Uplift
and Climate Change,” Scientific American 264
[1991]: 66–75.)
Mountains
Land
Ocean
The operation of A-GCMs incorporates the physi- compared with regional instrumental measurements of
cal laws and equations that govern the circulation of temperature, precipitation, pressure, and winds in the
Earth’s atmosphere: the fluid motion of air; conserva- present climate system averaged over the last several
tion of mass, energy, and other properties; and gas laws decades (for example, Figure 2–21). Areas of major dis-
covering the expansion and contraction of air. The indi- agreement between the model output and instrumental
vidual grid boxes in A-GCMs interact with their imme- observations often become the focus of additional
diate neighbors. improvements in the model.
Model runs begin with the atmosphere in a state of As noted earlier, A-GCM experiments on past cli-
rest. After solar heating causes air to begin to move, the mates require scientists to specify major changes in
model is run long enough for the atmosphere to reach a boundary conditions on the basis of geological evidence
state of equilibrium (Figure 2–20). Equilibrium occurs from Earth’s history. In one approach, called a sensitivity
when the long-term drift in the simulated climate data test, just one boundary condition is altered in relation to
disappears. The oscillations that remain are analogous the present-day configuration. When the output of such
to short-term changes in weather over days and weeks. an experiment is compared with the output from the
Running climate experiments on current-genera- modern control case, the differences in climate between
tion A-GCMs requires a simulation of at least 20 years the two runs isolate and reveal the unique impact caused
of climate. The first 15 years of the simulation are the by the change in that one boundary condition.
“spin-up” interval, used to let the model attain a state of In contrast, a climate reconstruction requires chang-
equilibrium. The last 5 years of the simulation produce ing all known boundary conditions at the same time to
the climate data that form the actual output of the try to simulate the full state of the climate system at
model. For the control-case simulation of modern some time in the past. This approach is more demanding
climate, the climate-data output from the GCM are than a sensitivity test, because all the potentially critical